2017 Half lf Year Results Presentation 15 May 2017 Disc iscla - - PDF document

2017 half lf year
SMART_READER_LITE
LIVE PREVIEW

2017 Half lf Year Results Presentation 15 May 2017 Disc iscla - - PDF document

Monday, 15 May 2017 2017 Half-Year Results Investor Presentation Attached is the investor presentation in connection with the financial results for the 6 month period ended 31 March 2017. Elders CEO, Mark Allison, and CFO, Richard Davey, will


slide-1
SLIDE 1

1 Monday, 15 May 2017

2017 Half-Year Results Investor Presentation

Attached is the investor presentation in connection with the financial results for the 6 month period ended 31 March 2017. Elders CEO, Mark Allison, and CFO, Richard Davey, will deliver this presentation by webcast and simultaneous teleconference at 10.00am (AEST) today. As advised to the ASX on Thursday 11 May 2017, you can register to view and listen to the live commentary of the presentation. For details, refer to that announcement. Peter Hastings Company Secretary

slide-2
SLIDE 2

Eld lders Lim imited 2017 Half lf Year Results Presentation

15 May 2017

slide-3
SLIDE 3

Disc iscla laim imer and im important in informatio ion

Forward looking statements This presentation is prepared for informational purposes only. It contains forward looking statements that are subject to risk factors associated with the agriculture industry many of which are beyond the control of Elders. Elders’ future financial results will be highly dependent on the outlook and prospect

  • f the Australian farm sector, and the values and volume growth in

internationally traded livestock and fibre. Financial performance for the

  • perations is heavily reliant on, but not limited to, the following factors:

weather and rainfall conditions; commodity prices and international trade

  • relations. Whilst every endeavour has been made to ensure the

reasonableness of forward looking statements contained in this presentation, they do not constitute a representation and no reliance should be placed on those statements. Non-IFRS information This presentation refers to and discusses underlying profit to enable analysis

  • f like-for-like performance between periods, excluding the impact of

discontinued operations or events which are not related to ongoing operating

  • performance. Underlying profit measures reported by the Company have

been calculated in accordance with the FINSIA/AICD principles for the reporting of underlying profit. Underlying profit is non-IFRS financial information and has not been subject to review by the external auditors, but is derived from audited accounts by removing the impact of discontinued

  • perations and items not considered to be related to ongoing operating

performance.

slide-4
SLIDE 4
  • Lost time injuries increase to 5 from 2
  • Statutory net profit after tax of $38.3m, up $13.7m
  • Underlying net profit after tax of $34.9m, up $12.3m
  • Underlying EBIT of $41.3m, up $13.2m
  • Operating cash outflow $5.3m for the half, down $19.2m
  • Underlying return on capital of 30.2%, up from 26.4% at March 2016
  • Realisation of all hybrids resulting in a simplified capital structure
  • Underlying earnings per share 29.7 cents, up 10.6 cents

FY FY17 Half Year in in Review

Solid lid pe performance for

  • r financia

ial l me metr trics 3

slide-5
SLIDE 5

Progress on FY FY17 Prio iorities

Deliv liverin ing our pr prom

  • mises to

to stakehold lders

Operational Performance Key Relationships Safety Performance Efficiency and Growth

  • $41.3m underlying EBIT, up

$13.2m on last year

  • Underlying ROC at 30.2%, up

from 26.4% at March 2016

  • Retail ROC improved from 13.3%

to 22.2%

  • Leverage ratio steady at 2.3
  • Interest cover ratio improved

from 7.9 to 8.2

  • On track to resume ordinary

dividends for FY17

  • Strengthened relationships in

aligned financial service providers

  • Continue to work with retail key

suppliers, including improved position in WA fertiliser market

  • Expanded digital client offerings
  • Formalised rural charitable

partnerships through launch of “Elders Give It”

  • Continue to engage with key

agricultural research bodies

  • Lost time injuries increase to 5

from 2, target is zero LTIs

  • LTI frequency rate at 1.7
  • 50% decrease in days lost, March

2017 year to date

  • Risk based decision making

training developed

  • Continued emphasis on

employee and community health and wellbeing

  • Continue to drive branch efficiency

improvement program

  • Real Estate footprint expansion in

Western Australia

  • Driving organic growth through

improving sales force performance and attracting high performers

  • Further 10% acquisition of Elders

Insurance

  • 30% acquisition of StockCo
  • Structured review process of capital

and cost initiatives

  • Realisation of all hybrids resulting in a

simplified capital structure

4

slide-6
SLIDE 6

Half Year Fin Financial Perf rformance

$ $ mill illion 1H 1H FY17 FY17

Change

1H 1H FY16 FY16

$m % Sales revenue 698.2

83.2 14%

615.0 Underlying EBIT 41.3

13.2 47%

28.1 Underlying profit after tax 34.9

12.3 54%

22.6 Reported profit after tax 38.3

13.7 56%

24.6 Net debt 170.4

44.4 35%

126.0 Operating cash flow (5.3)

19.2 138%

13.9 Average working capital 235.5

8.0 4%

227.5 Underlying return on capital (%) 30%

4% 15%

26% Underlying earnings per share (cents) 29.7

10.6 55%

19.1

5

slide-7
SLIDE 7

22.6 34.9 6.5 5.8 0.6 4.7 (0.2) (3.8) (1.2)

Underlying profit movement

$ million

Product margin

  • Retail benefited from improved summer cropping conditions and geographical expansion
  • Agency uplift with continued strong livestock prices and benefit from footprint growth
  • Real Estate earnings improved with high farm land property turnover
  • Financial Services boosted by StockCo and Elders Insurance acquisitions
  • High input costs continue to adversely impact the overseas Feed and Processing businesses
  • Higher costs to drive Eight Point Plan initiatives, including acquisitions and footprint growth
  • Tax and non-controlling interests higher due to improved performance in partnerships

Retail Products Agency Services Real Estate Services Financial Services Feed and Processing Services Costs Interest, tax & NCI 1H FY16 Underlying Profit 1H FY17 Underlying Profit

Perf rformance by Product

Ma Margin imp mprovement across pr prod

  • duct

ct ra range

6

slide-8
SLIDE 8

Perf rformance by Geography

Imp mprovement across Au Australian bu business un units ts, he headwinds for

  • r inte

nternational segm gment

22.6 34.9 6.4 5.4 2.8 (0.4) (0.6) (1.2)

Underlying profit movement

$ million

  • Northern Australia benefitted from high cattle prices, normalised summer retail performance, and upside from geographical expansion
  • Southern Australia performance driven by retail improvements and acquisitions, along with livestock agency upside from both high cattle prices

and footprint expansion

  • Western Australia improvement through higher livestock agency earn and increased farm land real estate sales
  • High input costs continue to adversely impact the International margins
  • Higher corporate and unallocated costs from increased incentives resulting from improved profitability across the business
  • Tax and non-controlling interests higher due to improved performance in Australian partnerships

1H FY16 Underlying Profit 1H FY17 Underlying Profit Northern Australia Southern Australia Western Australia International Corporate and unallocated costs Interest, tax & NCI

7

slide-9
SLIDE 9

Capital Employed

Re Retu turn on

  • n capital well in

n exce cess of

  • f targeted 20%

26 26.4 .4% 28 28.4 .4% 30 30.2 .2%

Mar-16 Sep-16 Mar-17

Unde nderly lyin ing Retu turn on n Cap apit ital

  • Underlying return on capital drivers:
  • Increased profitability of the Retail business
  • Continued strong Agency earnings,

particularly Livestock, which requires minimal working capital

  • Higher working capital balances, arising from:
  • Increased activity in Retail
  • Increase at balance date due to higher

livestock activity in the Agency business

  • Investment in Financial Services through

provision of shareholder funding to StockCo

  • Higher livestock prices and increase in
  • ccupancy at the Killara feedlot
  • Lower Live Export balances due to reduced

shipping activity $ million Ma Mar-16 16 Ma Mar-17 17 Change Retail Products 119.3 134.9 13% Agency Services 30.2 64.2 113% Financial Services (1.5) 5.6 Nm Feed & Processing Services 48.4 54.8 13% Live Export Services 45.1 8.1

  • 82%

Other (35.4) (36.0)

  • 2%

Wor Working capital (ba balance ce dat date) 206.1 231.6 12% 12% Wo Work rking capital (aver erage) 227.5 235.5 4% 4%

Wor

  • rkin

king Cap apital 8

slide-10
SLIDE 10

44.5 (5.3) (7.2) 7.2 (16.1) (1.1) (4.8) (22.1) (1.4) (8.9) (2.7) (1.8)
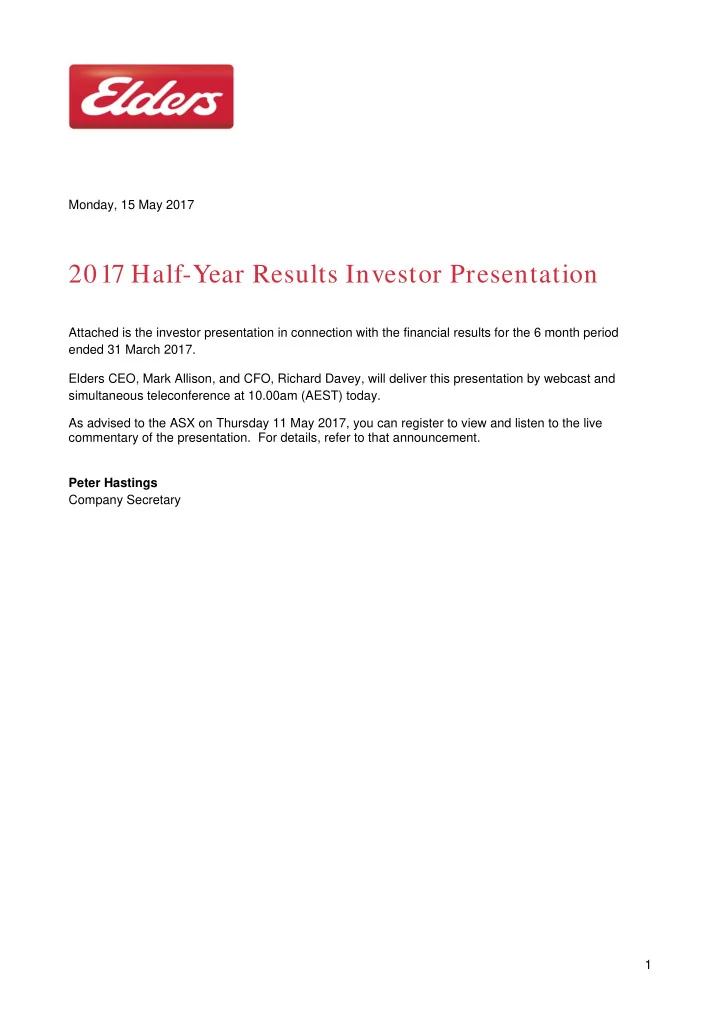
Cash flow

$ million

Operating Cash Flo Flow

Po Positive EB EBITDA A of

  • ffset by

by working capital mo movements

  • Strong EBITDA cash conversion, offset by

increased working capital usage

  • Working capital usage reflects:
  • Higher activity in the Agency business

leading up to balance date

  • Investment in Financial Services through

provision of shareholder funding to StockCo

  • Increased occupancy and higher cattle

prices in the Feed and Processing feedlots

  • Reduction in Live Export working capital

balances in line with reduced shipping activity

Retail Agency Real Financial Feed & Live Other Total $ million Products Services Estate Services Process Export EBITDA adjusted 18.7 24.2 6.7 4.8 3.7 0.1 (13.8) 44.5 Working capital (4.8) (22.1) (1.4) (8.9) (16.1) 7.2 (1.1) (47. 7.1) Interest, tax and dividends (2.7) (2.7) 7) Operating cash flow 13.9 2.1 5.4 (4.1) (12.4) 7.3 (17.5) (5.3) 3)

Retail Products Agency Services Financial Services Feed and Processing Services Live Export Other Interest, tax & dividends Capex EBITDA Operating Cash Flow Free Cash Flow Real Estate Services

9

Working capital movements

slide-11
SLIDE 11

Net t Debt

Key de debt t ra rati tios sta table

  • Increase in net debt at balance date represents net

hybrid outflow, higher working capital balances and investments in Elders Insurance and StockCo

  • Average net debt steady over period
  • Despite higher net debt at balance date, key ratios

have remained stable due to strong EBITDA generation Key Ratios Mar-16 16 Ma Mar-17 17 Change Leverage (net debt to underlying EBITDA) 2.3 2.3

  • Interest cover (underlying EBITDA to net interest)

7.9 8.2 4% Gearing (net debt to equity) 98% 95% 3%

126 144 170 170 142 142

At balance date Average YTD

Net debt

$ million

At balance date YTD average Mar-16 Mar-17 Mar-16 Mar-17

10

slide-12
SLIDE 12

Path thway to FY FY17 Target

  • Favourable summer cropping season
  • Livestock prices remain strong
  • Full year benefit of footprint expansion in retail and livestock segments
  • Increased Financial Services earnings through acquisitions
  • Investment in Real Estate bolt-ons including Southern Districts Real Estate
  • Expected lower rainfalls impacting the winter cropping season
  • Livestock prices expected to gradually decline in the second half
  • Easing of farm land real estate earnings
  • Continued pressure in Feed and Processing until lower input costs eventuate
  • Increased employee incentives

Tailwinds Headwinds

11

slide-13
SLIDE 13

FY FY17 Outlook

Grad radual de decl cline in n livesto tock ck pr price ces expecte ted Re Reta tail

  • Rainfall is forecast to be below average and temperatures higher than average for most of Australia to June, potentially impacting crop
  • yields. Acquisition and footprint expansion during the second half of the 2016 financial year are expected to deliver further benefits.

Age Agency cy

  • Tight supply for both sheep and cattle is expected to continue throughout winter and into early spring. Prices are expected to remain

buoyant in the short term but will subside as volumes increase later in the year. Price decline will be accelerated if the forecasted drier than average winter conditions occur, with growers forced to offload livestock earlier. Wool bales received in store suggest activity will improve in the second half. Re Real Es Esta tate Services

  • Demand for farm land property is expected to ease in line with the potential decline in livestock prices. Western Australian

performance is expected to lift with the acquisition of Southern Districts Estate Agency bolstering sales agency and property management earnings. Financial Services

  • Earnings growth achieved in the first half is expected to continue with the StockCo and Insurance acquisitions.

Feed & Pr Proce

  • cessing
  • Killara feedlot margins on principally held cattle will continue to be under pressure from high supply costs (cattle prices). Margin

pressure will continue for the international operations until cattle prices ease. Cost and nd Capital

  • Continued focus on controlling underlying cost base and improving productivity measures throughout the business. Investment in

strategic and growth initiatives will increase cost and capital usage.

12

slide-14
SLIDE 14

Eig ight Poin int Pla lan

13

slide-15
SLIDE 15

Bala lanced gr growth pla lan to FY FY20

Organic 40% Acquisition 40% Cost 20%

  • Drive continuous business

improvement

  • Capture growth opportunities

across our product and services portfolio

  • Explore opportunities to expand
  • ur offering and leverage the

Elders brand into new markets to capture new clients and customers

  • Continuously drive and resource

values based leadership through the organisation

  • Investment in the development
  • f our leaders and people
  • Build deeper understanding of
  • ur customers to deliver

profitable value add products and services

  • Continue to evaluate strategically

aligned opportunities to expand

  • ur business
  • Identify innovative solutions to

target geographical and strategic gaps

  • Maintain a disciplined approach to

ensure acquisitions meet required financial hurdles

  • Reallocation of capital from non-

performing assets will occur if financial and quality targets are not met

  • Efficiency gains through active

cost management

  • Reallocation and reduction of

unproductive costs

  • Develop and implement

improved processes and approaches

  • Maintain robust and conservative

financial discipline

14

slide-16
SLIDE 16

APPENDIX

slide-17
SLIDE 17

Business Model

Grain Livestock Wool Fertiliser Agri Finance Insurance Elders China Farm Supplies Killara Feedlot Farmland Elders Indonesia

Killara 53k head Indonesia 16k head China $15m sales 9.0m head sheep 1.6m head cattle 367k wool bales 0.4m grain tonnes

`

$2.8b loan book * $1.5b deposit book * $44m StockCo book * $610m gross written premium *

* Principal positions are held by

Rural Bank, StockCo and Elders Insurance (QBE subsidiary) respectively

$1b retail sales 629k tonnes fertiliser

Agency Services Retail Products Financial Services Real Estate Services Feed & Processing Services Residential Property Management Franchise Digital & Technical Services Auctions Plus (50%) Elders Weather

Auctions Plus 578k head sheep 93k head cattle Elders Weather 64.4m hits

Fee for Service

$889m Farmland sales $568m Residential sales 6,950 Properties under management 134 franchisees

16

Based on FY16 statistics (full year)

slide-18
SLIDE 18

Business Segm gmentation

$ million Northern Australia Southern Australia Western Australia International Geographies 1H FY17 Margin Average Working Capital Retail Products Farm Supplies and Fertiliser 59.6 163 Agency Services Livestock, Wool, and Grain 65.2 42 Real Estate Services Farmland, Residential, Property Management, Franchise 15.8 2 Financial Services Agri Finance, Insurance and Financial Planning 16.7 5 Feed & Processing Services Killara Feedlot Indonesia China 8.3 50 1H FY17 Margin 63.5 72.9 27.0 2.2 165.6

17

slide-19
SLIDE 19

Business Perf rformance by Product

53.1 59.4 15.2 12.0 8.4 59.6 65.2 15.8 16.7 8.3 1H FY16 1H FY17 +10% 0% +4%

  • 1%

1%

Margin by product

$ million

+12% 2% +39% 9%

Retail Products 36% Agency Services 39% Real Estate Services 10% Financial Services 10% Feed and Processing Services 5%

Margin generated by product

  • Re

Reta tail: : Benefited from improved summer cropping conditions and geographical expansion

  • Age

Agency cy: Continued strong livestock prices and benefit from footprint growth

  • Re

Real Es Esta tate: : Earnings improved with high farm land property turnover

  • Financial Services:

: Margin boosted by StockCo and Elders Insurance acquisitions

  • Feed and

nd Pr Proce

  • cessing: High input costs continue to

adversely impact the overseas Feed and Processing businesses

Retail Products Agency Services Real Estate Services Financial Services Feed and Processing Services

18

slide-20
SLIDE 20

Business Perf rformance by Geography

Northern Australia 38% Southern Australia 44% Western Australia 16% International 2%

Margin generated by geography

  • Nor
  • rth

thern Au Austr tralia: : Benefitted from high cattle prices, normalised summer retail performance, and upside from geographical expansion implemented during FY16

  • Sou
  • uth

thern Au Austr tralia: : Performance driven by retail improvements and acquisitions, along with livestock agency upside from both high cattle prices and footprint expansion

  • We

Western Au Austr tralia: Improvement through higher livestock agency earn and increased farm land real estate sales

  • Inte

nternational: : High input costs continue to adversely impact the International businesses

Northern Australia Southern Australia Western Australia International

55.3 66.1 24.1 2.7

63.5 72.9 27.0 2.2

1H FY16 1H FY17

+15% +10% +12%

  • 17%

Margin by geography

$ million

19

slide-21
SLIDE 21

Underlying NPAT $(10m) $(7.5m) $(5m) $(2.5m) NPAT +$2.5m +$5m +$7.5m +$10m Sheep price

  • $20
  • $10

+$10 +$20 Cattle price

  • $100
  • $50

+$50 +$100 Sheep volume

  • 1m head
  • 500k head

+500k head +1m head Cattle volume

  • 200k head
  • 100k head

+100k head +200k head Retail sales

  • $50m
  • $25m

+$25m +$50m Retail GM%

  • 100bps
  • 50bps

+50bps +100bps AgChem GM%

  • 200bps
  • 100bps

+100bps +200bps Fertiliser GM%

  • 200bps
  • 100bps

+100bps +200bps Killara utilisation %

  • 20%
  • 10%

+10% +20% SG&A Costs

  • 2%
  • 1%

+1% +2%

Profit Sensitivity

20

slide-22
SLIDE 22

Str trategic Gap Analysis

Re Reta tail

  • Target for 20% market share
  • Fertiliser growth in WA through CSBP
  • Increase presence in horticulture industry
  • Expand skill base and value add to grow fee for service

advisory Age Agency cy

  • Targeted footprint and agent growth in livestock services
  • Expand grain network accumulation

Re Real Es Estate

  • Increase company owned presence in major regional

centres in Australia

  • Aggressively expand franchise network

Financial Services

  • Increase productivity of banking staff
  • Growth in Insurance gross written premiums
  • Growth in StockCo livestock product

Feed and nd Pr Proce

  • cessing
  • Controlled growth in feedlots
  • Expansion of fine food beef business into ASEAN countries

21

slide-23
SLIDE 23

Poin ints of f Presence

  • Over 440 points of presence in Australia and overseas including

full service branches, real estate and insurance franchises

  • Key produce areas covered through our footprint
  • Targeted expansion of footprint through recruitment and

acquisition

22

slide-24
SLIDE 24