
1
RESIDENTIAL RESIDENTIAL MARKET UPDATE MARKET UPDATE
Van Rose, MIRM Van Rose, MIRM
President, Rose and President, Rose and Womble Womble New Homes New Homes March 12, 2008 March 12, 2008
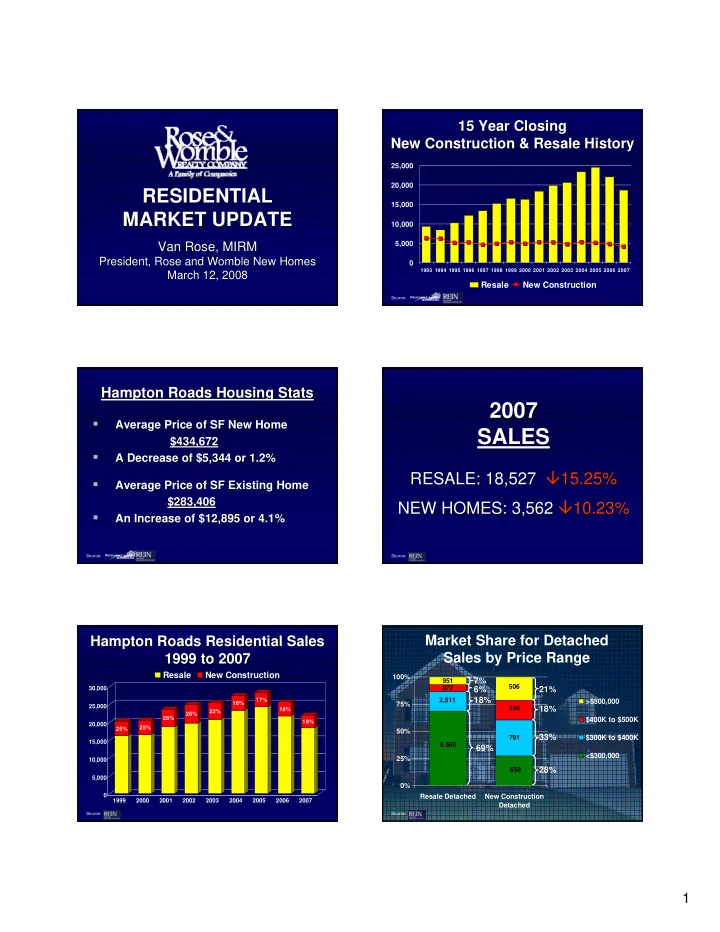
15 Year Closing 15 Year Closing New Construction & Resale History New Construction & Resale History
Source:
5,000 10,000 15,000 20,000 25,000
1993 1994 1995 1996 1997 1998 1999 2000 2001 2002 2003 2004 2005 2006 2007
Resale New Construction
Hampton Roads Housing Stats Hampton Roads Housing Stats
- Average Price of SF New Home
Average Price of SF New Home $434,672 $434,672
- A Decrease of $5,344 or 1.2%
A Decrease of $5,344 or 1.2%
- Average Price of SF Existing Home
Average Price of SF Existing Home $283,406 $283,406
- An Increase of $12,895 or 4.1%
An Increase of $12,895 or 4.1%
Source:
2007 2007 SALES SALES
RESALE: 18,527 RESALE: 18,527 15.25% 15.25% NEW HOMES: 3,562 NEW HOMES: 3,562 10.23% 10.23%
Source:
Hampton Roads Residential Sales Hampton Roads Residential Sales 1999 to 2007 1999 to 2007
Source:
25% 25% 26% 26% 22% 18% 17% 18% 19% 5,000 10,000 15,000 20,000 25,000 30,000 1999 2000 2001 2002 2003 2004 2005 2006 2007
Resale New Construction
Market Share for Detached Sales by Price Range
Source:
658 9,560 791 2,511 436 877 506 951 0% 25% 50% 75% 100% Resale Detached New Construction Detached >$500,000 $400K to $500K $300K to $400K <$300,000
69% 18% 6% 7% 21% 18% 33% 28%