2/5/2009 Contents Economic scenario and growth engines Human - - PDF document

2 5 2009
SMART_READER_LITE
LIVE PREVIEW

2/5/2009 Contents Economic scenario and growth engines Human - - PDF document

2/5/2009 Contents Economic scenario and growth engines Human Resource Requirements in various states The supply side situation and demand supply gap Recommendations The way ahead Skill Development Initiatives the way ahead ICRA


slide-1
SLIDE 1

2/5/2009 1

www.imacs.in

Skill Development Initiatives – the way ahead

ICRA Management Consulting Services Limited

Contents

Human Resource Requirements in various states Economic scenario and growth engines

v

The way ahead The supply side situation and demand supply gap Recommendations

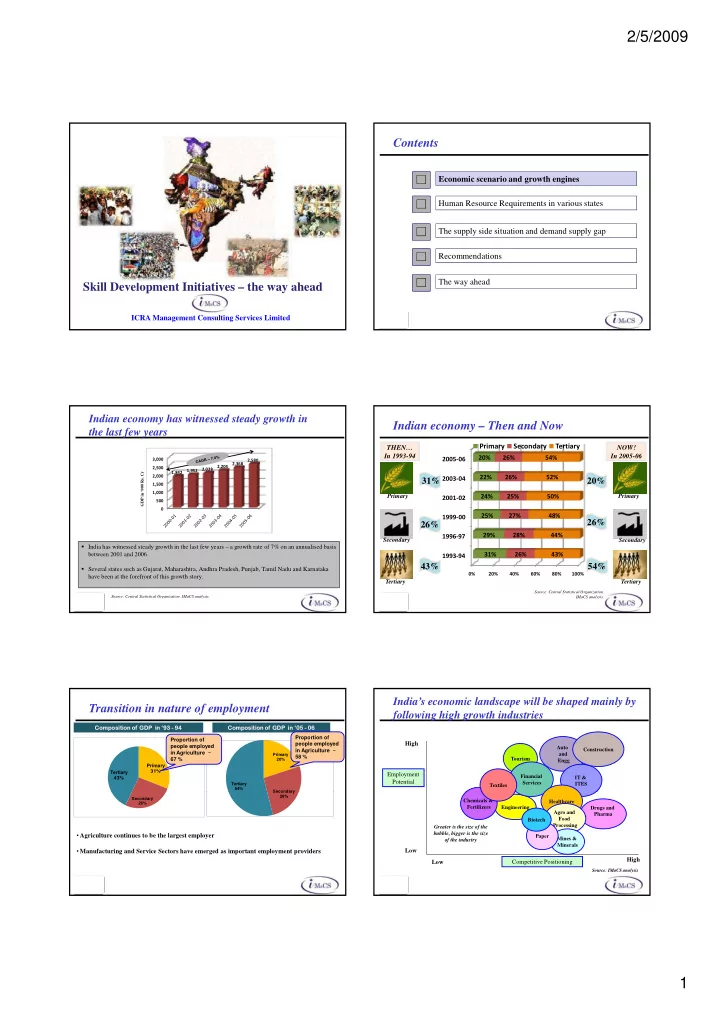
Indian economy has witnessed steady growth in the last few years

500 1,000 1,500 2,000 2,500 3,000 1,842 1,952 2,028 2,204 2,368 2,580 GDP in ‘000 Rs. Cr

v

Source: Central Statistical Organization, IMaCS analysis.

India has witnessed steady growth in the last few years – a growth rate of 7% on an annualised basis between 2001 and 2006. Several states such as Gujarat, Maharashtra, Andhra Pradesh, Punjab, Tamil Nadu and Karnataka have been at the forefront of this growth story.

Indian economy – Then and Now

THEN… In 1993-94

Primary

31%

NOW! In 2005-06

20%

2001‐02 2003‐04 2005‐06 24% 22% 20% 25% 26% 26% 50% 52% 54%

Primary Secondary Tertiary

Primary

v

Tertiary Secondary

26% 43% 26% 54%

Source: Central Statistical Organization, IMaCS analysis.

0% 20% 40% 60% 80% 100%

1993‐94 1996‐97 1999‐00 31% 29% 25% 26% 28% 27% 43% 44% 48%

Secondary Tertiary

Transition in nature of employment

Primary 31% Tertiary 43%

Primary 20% Secondary Tertiary 54%

Compos mposit ition ion of

  • f GD

GDP P in ‘ ‘93 3 - 94 Compos mposit ition ion of

  • f GD

GDP P in ‘ ‘05 5 - 06 Proportion of people employed in Agriculture ~ 67 % Proportion of people employed in Agriculture ~ 58 %

v

Secondary 26% Secondary 26%

  • Agriculture continues to be the largest employer
  • Manufacturing and Service Sectors have emerged as important employment providers

Auto and Engg

India’s economic landscape will be shaped mainly by following high growth industries

Employment Potential High

IT & ITES Construction Tourism Financial Services Textiles

v

Source: IMaCS analysis

Drugs and Pharma

Competitive Positioning Low High Low

Engineering Greater is the size of the bubble, bigger is the size

  • f the industry

Healthcare Agro and Food Processing Chemicals & Fertilizers Mines & Minerals Paper Biotech

slide-2
SLIDE 2

2/5/2009 2

Contents

Human Resource Requirements in various states Economic scenario and growth engines

v

The supply side situation and demand supply gap Recommendations

IMaCS has conducted skill mapping studies in various states and identified human resource requirements

IMaCS has conducted skill mapping studies in association with Confederation of India

Industry (CII) in several states

The studies have been conducted in a cross section of states: Tamil Nadu

v

Andhra Pradesh Maharashtra Jammu and Kashmir Punjab These studies present the dimensions of the skill gap problem.

Employment projections in major industries in select states - till 2015

1.8 to 2 million 0.3 to 0.5 million 0.2 to 0.3 million v 13 to 15 million 7.5 to 8 million

Source: IMaCS analysis

6 to 6.5 million

Employment (in 000s) 4500-5000 2200-2300 1050-1100 9000 4000-4100 2000-2200 Leather Construction Textiles

A snapshot of how these human resource requirements span

  • ut in Tamil Nadu for high growth industries

2015 Curren t Incremental 2015 (in 000s)

4500-5500 1800 900-1150 % of incremental 36%-39% 13%-14% 7%-8%

v

120-125 70-80 55-65 50-60 30-35 380-390 520-580 300-350 380-450 45-50 Light Engineering IT ITES Auto Financial Services

Source: IMaCs analysis 260-265 450-500 285-300 320-400 20 2% 3-4% 2% 3% 0.1%-0.2% Total incremental employment (in million) 13-15

A snapshot of how these human resource requirements span out in Maharashtra for high growth industries

Banking, Financial Services, and Insurance IT and ITES Organised Retail Construction 764 464 659 3,064 417 1,203 1,143 1,916 4,402

Key Industries

Incremental human resource Requirement till 2012 (in ‘000s) 1,338 1,257 679 440 180

v

Source: IMaCS analysis

  • 500

1,000 1,500 2,000 2,500 3,000 3,500 4,000 4,500 Auto and Auto Components Chemicals and Petrochemicals Engineering Pharmaceuticals Agro Processing 119 197 292 303 237 164 307 450 480 Employment by 2011-12 ('000s) Current Employment ('000s) 2006-07

180 117 158 110 45

Total Demand – all industries* - 6 to 6.5 million

* - The secondary and tertiary sectors considered here exclude sectors such as Utility Services, Public Administration and Defence, Transport, Storage and Communication, Unorganised Trade.

A snapshot of how these human resource requirements span out in Andhra Pradesh for high growth industries

Incremental Human Resources Requirement till 2015 (in 000s) 2,010 1,081 741 515 248 559

Key Industries

230 851 290 152 745 2,200 478 1,366 850 893 1,826 4,210 Drugs and Pharma Tourism Healthcare IT and ITES Textiles Construction

v

248 132 116 111 83 44 19 11

Source: IMaCS analysis

21 5 87 198 114 99 135 230 33 24 131 280 225 215 268

  • 500

1,000 1,500 2,000 2,500 3,000 3,500 4,000 4,500 Paper Biotech Chemicals and Fertilizers Agro and Food processing Mines and Minerals Engineering Banking and Insurance Drugs and Pharma Workforce in '000 s Employment by 2014-15 ('000) Current Employment (000)

Total Demand - 7.5 to 8 million

slide-3
SLIDE 3

2/5/2009 3

Roughly 1.9 million Sector Employment ('000) 2006 2015 Incremental (current - 2015)

Textiles 305 540 235 Auto & auto components 54 96 42 Food processing 170 300 130 Li ht i i 345 720 375

A snapshot of how these human resource requirements span out in Punjab for high growth industries

v

people needed in the high growth industries and 2.9 million in overall industry by 2015

Light engineering 345 720 375 IT & ITES 13 75 62 Real estate & construction 910 1720 810 Retail and location-based entertainment 30 325 295

Total in high growth industries

1827 3776 1949

Other industries 297 1284 987

Total in economy

2124 5060 2936

The human resource requirements will be at various levels as illustrated below

Specialised Skills

Skill Category Level II Skill Category Level

TN AP Punjab J&K Maharashtra

3 - 4 % 21 – 27% 4 - 5% 10- 12% 1 - 3 % 22 – 28% 1% 24 – 29% 6 - 7% 35 - 37% 24 26%

v

Skill Category Level I Minimal Education (Skillable)

70 – 75% 45 - 46% 38 - 40% 70 – 75% 80 – 85% 31 - 33% 24- 26% 1.8 to 2 million 13 to 15 million 0.2 to 0.3 million 6 to 6.5 million 7.5 to 8 million

Total Demand

Contents

Human Resource Requirements in various states Economic scenario and growth engines

v

The supply side situation and demand supply gap Recommendations

The expected economic growth of over 8% necessitates demand for skilled workforce. However…

  • In the age group
  • f 20 24 years
  • Only 10.1% of

male workers and 6% of female workers had marketable v

  • 44% of all

workers illiterate

  • 22.7% of

workers – only primary schooling

  • f 20-24 years,
  • nly 5% of the

workforce had vocational skills

  • While, Mexico

had 28% had marketable skills

  • While, Korea

had -96%; and

  • ther

industrialised countries – 60%-80%.

Source: Planning Commission, Government of India

… only a small portion of human resources have employable skills

Engineering Arts, Science, Commerce Vocational Education and Training

v

Source: Selected Educational Statistics 2004-05, Ministry of Human Resource Development, Government of India, Enrolments in the year 2005, NTMIS

~ 7 lakh ~ 98 lakh ~ 11 lakh Only 30% - 40% of students are employable

Key issues in the current education system

Lack of focus on employability Lack of industry – institute linkages

v

Inadequate practical orientation Infrastructure bottleneck Policy support

slide-4
SLIDE 4

2/5/2009 4

A sizeable portion of engineering graduates are unemployed…

A sizeable portion, about 18%, of the engineers who graduate are unemployed. About 12% of the engineers who graduate proceed for further studies in India or abroad. Only 30% to 40%

  • f

students find employment within one year of earning

Studying in Studying abroad 1.5% Unemployed 18.3%

Degree: Distribution of Engineers by Activity Status* v

Source: Annual Technical Manpower Review, NTMIS, IMaCS analysis * - for the state of Maharashtra

employment within one year of earning the degree While the above scenario is for Maharashtra, a similar situation has been

  • bserved in other leading states such as

Andhra Pradesh

Working in India 64.6% Working abroad 2.8% Self employed 2.6% S udy g India 10.2%

….this indicates that a significant portion of the workforce is unemployable.

A sizeable portion of diploma graduates are unemployed and many of those who graduate proceed for further studies…

A sizeable portion, about 15% to 20% of diploma graduates are unemployed* More than 35% proceed for further studies. While the above scenario is 20.20%

18%

0.16% 6.56% Distribution of Diploma Holders by Activity

Unemployed Studying in India Studying Abroad Self

v

Source: Annual Technical Manpower Review, NTMIS, IMaCS analysis * - for the state of Andhra Pradesh

While the above scenario is for Andhra Pradesh, a similar situation has been

  • bserved in other leading

states

39% 1% 1% 20% Employed

….this lays the seeds for a shortage in the workforce at the supervisory level.

Further, studies conducted by ILO reveal that there is significant scope for improvement in the ITI/ITCs…

Indicator Orissa Andhra Pradesh Maharashtra Student retention rate 80.9% 68.3% 85.6% Student graduation rate 88.3% 62.9% 77.5% Utilisation of seating 102.1% 77.4% 92.2% v

Source: ILO study on ‘ITI of India, the efficiency study report’, sample across 3 states – Orissa, Andhra Pradesh, and Maharashtra * - % of total number of sanctioned seats producing graduates

g capacity Overall internal efficiency* 73.8% 31.8% 62.6%

….this implies the need for increasing the overall efficiency of ITI/ITCs.

There are significant challenges in Higher and Technical Education*

Industry perceives that only around 40-50% are employable. Substantial time, effort, and cost is expended on training.

  • Currency of curriculum
  • Infrastructure
  • Need for Autonomy
  • Need to increase the reach and coverage
  • f Centre of Excellence (CoE) scheme in
  • Need to ease procedures for introduction of

courses and release of funds N d f ti l t i i d i i ht

v

Source: Primary surveys, IMaCS analysis * - Comprising Engineering, Arts and Science, Diploma Polytechnics and ITI/ITCs

Curriculum is not geared to meet the needs

  • f sunrise industries such as service sectors,

front-ending, retailing, sales and support

  • f Centre of Excellence (CoE) scheme in

ITI

  • Awareness of career opportunities is low
  • Need for practical training and insight
  • The need for structured integration of English

language skills into curriculum

  • Need to inculcate basic work skills in

curriculum, especially in Tier 2 cities

This leads to a demand-supply gap in the skilled workforce Demand v/s Supply gap for skilled Human Resource till 2015

Punjab Tamil Nadu Andhra Pradesh J&K 1.9 million 3 million 1.5 million 0.5 million

v

Source: IMaCS analysis

Tamil Nadu 3 million Demand Supply

Contents

Human Resource Requirements in various states Economic scenario and growth engines

v

The supply side situation and demand supply gap Recommendations

slide-5
SLIDE 5

2/5/2009 5

Identified high growth sectors across states

Construction, Pharma, Textiles, Tourism, Cement, Power, Repair Servicing, Light Engg, ITES Handicrafts, Hospitality, Agro- processing, Construction, ITES, Repair Servicing Textiles, Auto/ Auto components, Light Engg., Food Processing, Real Estate and Construction, Retail and Location based entertainment

v

Source: IMaCS analysis

Textiles, Construction, Auto / Auto components, Light Engineering, IT/ITES, Leather Construction, Textiles, Tourism, Healthcare, Engineering, IT/ITES, Pharma, Biotech, Paper, Minerals Banking, Financial Services and Insurance, Construction, IT and ITES, Auto and Engineering, Organised Retail, Pharmaceuticals, Chemicals and Petrochemicals

Common high growth sectors: Construction, IT and ITES, Tourism and Hospitality, Auto and Auto components, Engineering, Agro Processing, Organised Retail, Handicrafts, Servicing, Textiles

Underlines the need for sector level view of skill development issues in addition to state level view

State level studies Help identify unique requirements of each state Help identify key industries in each state Certain initiatives need to be addressed at the state level. v Sector level studies Help identify unique requirements of each sector Help in providing detailing for stakeholder interventions which are common across states and can be addressed at sector level, such as Cluster level initiatives Curriculum updation.

Broad skill development initiatives are required…

Skill development initiatives ‘targeted’ at the specific skill levels of the workforce is key to addressing the skill gaps in the various states and industries/sector. Specialised skills required for creating R&D, design, testing, and developing Intellectual Property. Sector focussed, employable skill

Specialised skills – skills such as Research and Development, Risk Management Skill Level II – skills such as software engineering, marketing, quality control Skill Level I – skills such as

v employable, skill development initiatives Generic employment generation initiatives

supervisory, maintenance, and specialised operations Semi-skilled – skills such as floor

  • perations,

basic equipment

  • perations,

handling repetitive machine tasks Minimally skilled - helping, cleaning, housekeeping

Employment Generation Initiatives

Employment Generation I i i i v Initiatives focussing on: Farm to Work Programme School to Work Programme Certification of Experiential Learning

A snapshot of generic employment generation initiatives…

Employment Generation Initiatives aims to focus on enabling employment generation especially in the backward regions targeted at those who are minimally educated. v

Farm to Work Programme

Certification of Experiential Learning School to Work

Cultivators who are moving out

  • f farming, marginal workers,

agricultural labourers who are not

  • ccupied

with farming during specific seasons. School leavers of working age, school educated youth who have not found jobs, school leavers who have not worked in the organised sector. Those who are illiterate or minimally educated but have significant

  • n

the job experience can avail of better employment

  • pportunities

if they can obtain independent certification of skills learnt.

Employability focussed skill development initiatives

Employability Development Initiatives focussing on: Development of Modular Services Training Centres (MSTCs) – Basic and Advanced Job Oriented Semester Programme Skills Registry and Information Cell Industry Posting Programme Awareness building for Modular Focus to Vocational Training v Focus to Vocational Training Demand-led Curriculum Enhancement Programme Performance Measurement and Outcome-led Funding

slide-6
SLIDE 6

2/5/2009 6

A snapshot of sector focussed, skill development initiatives aimed at increasing employability

Modular Services Training Centres Tap growing demand in Service Sector Job Oriented Semester Programme Increase industry- relevant practical skills Measure performance

  • f institutes – ITI,

ITCs and Polytechnics, link funding to outcomes, and thereby to demand Performance measurement and

  • utcome-led funding

v

Employability Skills Registry and Information Centre Create access to skilled human resource and market linkages Industry Postings ProgrammeTeacher Training Programmes to update knowledge Demand-led Curriculum Enhancement Programme Fine-tune curriculum to meet industry requirements and thereby to demand Awareness building for Modular Focus to Vocational Training Leverage on framework created by DGET to promote vocational skill building

Specialised Skill Development Initiatives

Specialised Skill Development Initiative focussing on: Sustaining competitiveness through development of specialised skills

v

A snapshot of Specialised Skill Development Initiatives…1

The Government, Industry and Institutes of higher learning work together to identify areas where specialised skill sets are required

Objective

Specialised skills, though employing a lesser proportion of human resource as compared to the other skill levels, is the driver of competitiveness Development of specialised skills is key to sustaining competitiveness. We propose that this be an active focus area of Government, Industry and Institutes of higher learning.

v

identify areas where specialised skill sets are required A nodal agency comprising all three spearheads the process Select institutes are identified where specialised courses are taught These courses would be at managerial and research levels Institutes of higher learning, Industry and Government work together in developing such courses Courses developed would be in the form of modules which can be covered in short duration These courses can be a part of the college curriculum for the benefit of students, and also be offered to mid and senior level working professionals who choose to upgrade their skills. – Modular delivery of specialised courses The courses can be funded by the Government/charged to Industry.

Implementation

A snapshot of Specialised Skill Development Initiatives…2

C t t

The following are some examples areas where specialised courses can be developed and offered: Auto and Engineering – Engineering Design and high end testing Construction – Project Management and Human Resource Management Chemicals and Petrochemicals – areas such as ‘Petrochemical Engineering’ Chemical manufacturing processes

v Content Areas

Engineering , Chemical manufacturing processes Pharmaceuticals – R&D and developing IPR IT and ITES – High-end computing, emerging technologies and architectures Agro Processing – new processes, preservation and treatment. Organised Retail – Supply Chain Management, Storage processes, Merchandising. Banking, Financial Services, and Insurance – Risk Management, Commodities, Banking operations, Microfinance.

The skill development initiatives require funding which can be raised through various models…

Partnership Model Best suited for employability development initiatives

v

Government Funded Model Private Funded Model Self Sustaining Model

Funding Models

Best suited for employment generation initiatives Best suited for developing specialised skills A mature state model when the initiatives become self sustaining

Disclaimer: ICRA Management Consulting Services Limited (IMaCS) do not assume any liability, financial or otherwise, for any loss or injury that the user of this document may experience in any transaction. All information contained herein is obtained by IMaCS from

Thank you

v

sources believed by it to be accurate and reliable. Although reasonable care has been taken to ensure that any information herein is true, such information is provided ‘as-is’ without any warranty of any kind and IMaCS, in particular, makes no representation or warranty, express or implied, to the accuracy, timeliness or completeness of any such information. The contents of this document may not be reproduced wholly or in part in any material form, including photocopying or storing it in any medium by electronic means, or communicated to any third party except with the written approval of IMaCS.