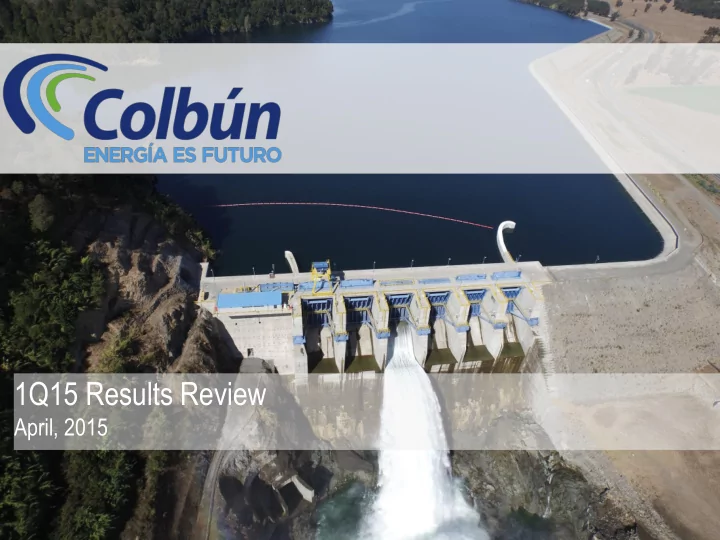

1Q15 Results Review April, 2015
2 AGENDA 1. HIGHLIGHTS 2. FINANCIAL REVIEW 3. RECENT EVENTS 4. GROWTH OPTIONS
3 HIGHLIGHTS OF 1Q 2015 Hydro Generation EBITDA Revenues 1 2 3 (GWh) (MMUS$) (MMUS$) 1% 23% 23% 413 120 1,109 1,098 93 317 1Q14 1Q15 1Q14 1Q15 1Q14 1Q15 4 5 6 Net Income Efficient Capacity over Net Debt (MMUS$) Commitments (%) (MMUS$) 11% 86% 24% 68 1,413 52 1,071 61 7 1Q14 1Q15 1Q14 1Q15 1Q14 1Q15
4 AGENDA 1. HIGHLIGHTS 2. FINANCIAL REVIEW 3. RECENT EVENTS 4. GROWTH OPTIONS
5 PHYSICAL SALES AND GENERATION BALANCE ANALYSIS Key Drivers of 1Q15 Sales Volumes 1Q14 1Q15 YoY GWh Regulated Customers 1,751 1,734 (1%) Lower hydroelectric generation Free Customers 1,233 1,048 (15%) Total Commitments (7%) 2,984 2,782 Spot Market Sales 219 327 49% 100% availability of Santa María I Total Energy Sales 3,203 3,109 (3%) Expiration of contracts with Codelco (at Generation 1Q14 1Q15 YoY GWh marginal cost) and Metro Hydroelectric 1,109 1,098 (1%) Thermal – Gas 1,357 1,147 (15%) Thermal – Diesel 96 141 47% Spot market sales of 327 GWh Thermal - Coal 706 792 12% Wind Power - Punta Palmeras - 18 - Total Own Generation 3,268 3,196 (2%) Spot Market 1Q14 1Q15 YoY GWh Sales 219 327 49% Purchases 0 0 - Net Spot Market 219 327 49%
6 EBITDA ANALYSIS Key Drivers of 1Q15 US$ million 1Q14 1Q15 YoY Lower EBITDA given by a non-recurring Revenues 413.2 317.0 (23%) income of US$ 32,5 million in 1Q14 Raw Materials and (275.4) (205.2) (25%) Consumables Used Personnel and other (18.1) (19.1) 5% Reduction in thermal generation costs operating expenses (US$/MWh) given by lower commodity EBITDA 119.8 92.8 (23%) prices EBITDA Margin (%) 29% 29%
7 NON OPERATING INCOME ANALYSIS Key Drivers of 1Q15 1Q14 1Q15 YoY US$ million Financial Income 1.5 1.0 (35%) Higher Financial Expenses of US$12 million Financial Expenses (10.6) (22.2) 109% Results of Indexation Units 2.4 0.1 (98%) Positive exchange rate difference given by a lower volatility of the CLP/US$ Exchange Rate Differences (8.9) 0.4 - exchange rate Share of profit (loss) from 1.3 1.5 11% equity-accounted associates US$9 million lower Other Income due Other income/expense 7.7 (0.9) - to non-recurring effects registered in NON-OPERATING (6.6) (20.2) 205% INCOME 1Q14.
8 NET INCOME ANALYSIS Key Drivers of 1Q15 1Q14 1Q15 YoY US$ million Net Income Before Tax 71.2 25.1 (65%) Income Tax expense of US$18.2 million (19.6) (18.2) Income Tax (7%) mainly given by: NET INCOME 51.5 7.0 (86%) Corporate Tax Rate increase (Tax Reform) 3% CLP/ US$ exchange rate depreciation Higher PPUAs
9 AGENDA 1. HIGHLIGHTS 2. FINANCIAL REVIEW 3. RECENT EVENTS 4. GROWTH OPTIONS
10 RECENT EVENTS January 1st, 2015 two new long term contracts with Codelco started. On February 18th, Blanco Hydroelectric Power Plant resumed commercial operations after more than 1 year out. In April 2015 Colbún prequalified for the public auction of Isagen. On April 22nd, the Ordinary Shareholder’s Meeting was held and approved a Definitive Dividend for US$12.7 million (US$ 0.000728/share) .
11 AGENDA 1. HIGHLIGHTS 2. FINANCIAL REVIEW 3. RECENT EVENTS 4. GROWTH OPTIONS
12 SEARCHING FOR INVESTMENT OPPORTUNITIES IN THE REGION Special focus in Colombia and Perú Growing electricity consumption Well established regulatory framework Diversification: Hydrological conditions Generation technologies Access to fuel sources Regulatory Risks
13 La Mina NCRE Project 34 MW of Installed Capacity and 190 GWh of expected annual generation Began construction on Dec14 As of Mar15 progress is according to schedule.
14 COLBÚN HAS SEVERAL GROWTH OPPORTUNITIES Projects in Chile Santa María II – Coal-fired Project 350 MW of Capacity 2,500 GWh of expected annual generation Phase: Environmentally Approved San Pedro - Hydroelectric Project 150 MW of Capacity 930 GWh of expected annual generation Phase: Preparation for submitting to EIA on the first half of 2015
This document provides information about Colbún S.A. In no case this document constitutes a comprehensive analysis of the financial, production and sales situation of the company. To evaluate whether to purchase or sell securities of the company, the investor must conduct its own independent analysis. This presentation may contain forward-looking statements concerning Colbun's future performance and should be considered as good faith estimates by Colbún S.A. In compliance with the applicable rules, Colbún S.A. publishes on its Web Site (www.Colbún.cl) and sends the financial statements of the Company and its corresponding notes to the Superintendencia de Valores y Seguros, those documents should be read as a complement to this presentation. INVESTOR RELATIONS TEAM CONTACT Miguel Alarcón María Elena Palma malarcon@colbun.cl mpalma@colbun.cl +(562) 2 460 4394 +(562) 2 460 4450 15
Recommend
More recommend