
SLIDE 1
15 October 2012 Important Notice The past performance of Keppel - - PowerPoint PPT Presentation
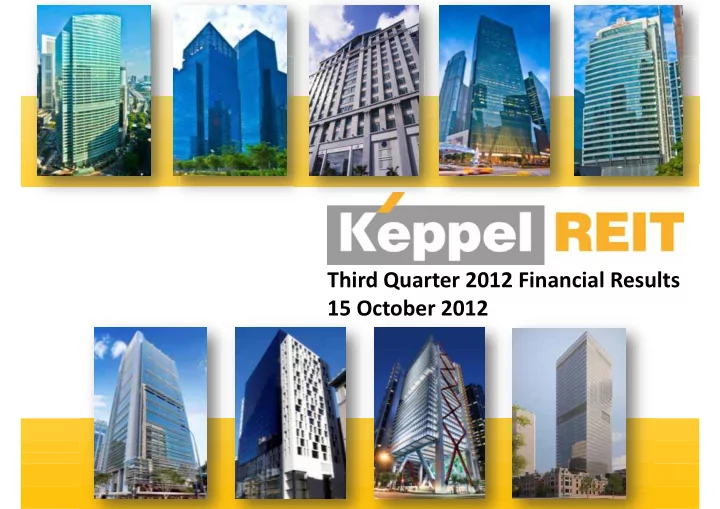
Third Quarter 2012 Financial Results 15 October 2012 Important Notice The past performance of Keppel REIT is not necessarily indicative of its future performance. Certain statements made in this presentation may not be based on historical
The past performance of Keppel REIT is not necessarily indicative of its future performance. Certain statements made in this presentation may not be based on historical information or facts and may be “forward-looking” statements due to a number of risks, uncertainties and assumptions. Representative examples of these factors include (without limitation) general industry and economic conditions, interest rate trends, cost of capital and capital availability, competition from similar developments, shifts in expected levels of property rental income, changes in operating expenses, including employee wages, benefits and training, property expenses and governmental and public policy changes, and the continued availability of financing in the amounts and terms necessary to support future business. Prospective investors and unitholders of Keppel REIT (Unitholders) are cautioned not to place undue reliance on these forward- looking statements, which are based on the current view of Keppel REIT Management Limited (as manager of Keppel REIT) (the Manager) on future events. No representation or warranty, express or implied, is made as to, and no reliance should be placed on, the fairness, accuracy, completeness or correctness of the information, or opinions contained in this presentation. None of the Manager, the trustee of Keppel REIT or any of their respective advisors, representatives or agents shall have any responsibility or liability whatsoever (for negligence or otherwise) for any loss howsoever arising from any use of this presentation or its contents or
revision, verification and amendment and such information may change materially. The value of units in Keppel REIT (Units) and the income derived from them may fall as well as rise. Units are not obligations of, deposits in, or guaranteed by, the Manager or any of its affiliates. An investment in Units is subject to investment risks, including the possible loss of the principal amount invested. Investors have no right to request the Manager to redeem their Units while the Units are listed. It is intended that Unitholders may
does not guarantee a liquid market for the Units. 1
Australia Properties
MBFC Towers 1 and 2 and Marina Bay Link Mall (33.3% interest) 77 King Street Office Tower, Sydney 275 George Street (50% interest), Brisbane Prudential Tower (92.8% interest) One Raffles Quay (33.3% interest) Ocean Financial Centre (99.9% interest) 8 Chifley Square (50% interest), Sydney
* Expected to be completed in 3Q 2013.
Bugis Junction Towers
Nine premium Grade A office assets valued at more than $6.35 billion with a total NLA of approximately 3.0 million sf Singapore Properties
Old Treasury Building Office Tower (50% interest), Perth
* Expected to be completed in 3Q 2015.
2
3
4
Ocean Financial Centre to 95.0% Prudential Tower to 100.0% 77 King Street to 97.4%
5
1H Distributable income 2H Distributable income
February August
Income period Payment dates
Previous Distribution Frequency
Current Distribution Frequency
Income period Proposed payment dates(1)
1Q Distributable income
November May
2Q Distributable income 3Q Distributable income 4Q Distributable income
August February
(1) Exact date of payment of distribution income may vary.
Distribution Timetable Trading on “Ex” Basis Friday, 19 October 2012 Books Closure Date Tuesday, 23 October 2012 Distribution Payment Date Tuesday, 27 November 2012 Distribution Per Unit (DPU) 1.96 cents Distribution Period 1 July 2012 – 30 September 2012
6
Distribution Per Unit (DPU) Distribution Period
Key Property and Transaction Details Description Premium Grade A office 35-storey Location 28 Barrack Street, Perth, Australia Net Lettable Area 165,750 sf (50% interest) Purchase Consideration $212.0 million (50% interest) Targeted Green Ratings 5-Star Green Star 4.5-Star NABERS energy rating
(1) Based on figures as at 30 September 2012, including the 25-year lease by the Government of Western Australia.
7
8
9
YTD Sep 2012 YTD Sep 2011 Change
Property Income $116.1m $55.3m $60.7m 109.7% Net Property Income $91.9m $43.9m $48.0m 109.3% Share of Results of Associates $34.8m $25.4m $9.4m 36.9% Distributable Income to Unitholders(1) $150.0m $77.2m $72.8m 94.3% Distribution Per Unit (DPU)
5.80 cents 3.06 cents(2) 2.74 cents 89.5%
7.75 cents 4.09 cents(2) 3.66 cents 89.5%
(1) The distributable income to Unitholders is based on 100% of the income available for distribution. (2) Restated to take into account the effect of the fully underwritten, renounceable 17-for-20 rights issue of 1,159,694,000 units at an issue price of $0.85 per rights unit and computed based on the issued units at the end of the period aggregated with 1,159,694,000 units which were issued on 13 December 2011.
$55.3 m $43.9 m $25.4 m $77.2 m $116.1 m $91.9 m $34.8 m $150.0 m
Property Income Net Property Income Share of Results of Associates Distributable Income
YTD Sep 2011 YTD Sep 2012
10
1Q 2012 2Q 2012 3Q 2012 YTD Sep 2012 Annualised 2012 Forecast
DPU
3Q 2012 2Q 2012 1Q 2012 YTD Sep 2012 2012 Forecast(1)
Distribution Per Unit (DPU)
1.96 cents 1.94 cents 1.90 cents 5.80 cents 7.16 cents
7.80 cents 7.80 cents 7.64 cents 7.75 cents 7.16 cents
(1) As published in the Circular to Unitholders dated 19 October 2011.
7.75 cents 7.16 cents(1)
1.90 cents 1.94 cents 1.96 cents
(1)
11
As at 30 Sep 2012 As at 30 Jun 2012 Non-current Assets $5,789 m $5,785 m Total Assets $5,945 m $5,975 m Borrowings(1) $2,800 m $2,780 m Total Liabilities $2,668 m $2,645 m Unitholders’ Funds $3,275 m $3,327 m Net Asset Value (NAV) Per Unit $1.25 $1.27 Adjusted NAV Per Unit(2) $1.23 $1.23
(1) These include borrowings accounted for at the level of associates and excludes the unamortised portion of upfront fees in relation to the borrowings. (2) For 30 September 2012, this excludes the distributable income to be distributed in November 2012. For 30 June 2012, this excludes the distributable income to be distributed in August 2012.
12
13
(1) These include borrowings accounted for at the level of associates and excludes the unamortised portion of upfront fees in relation to the borrowings. (2) Average all-in interest rates for the respective quarters include cost of swapping floating interest rates to fixed rates. (3) Figures for the respective quarters. Interest coverage ratio = Ratio of quarter earnings before interest, tax, depreciation and amortisation divided by interest expense. (4) These include Keppel REIT’s proportionate share of the deferred payments due to the construction of the car park and retail podium at Ocean Financial Centre. (5) The debt weighted average term to expiry will extend to 3.4 years when the $598 million loans due for refinancing on 31 December 2012 are refinanced for 5 years to 2017. The actual debt weighted average term to expiry as at 30 September 2012 is 2.3 years.
As at 30 Sep 2012 As at 30 Jun 2012 Gross Borrowings(1) $2,800 m(4) $2,780 m(4) Aggregate Leverage 44.1% 43.9% Average All-in Interest Rate(2) 2.00% 2.00% Interest Coverage Ratio(3) 5.2 times 5.3 times Weighted Average Term to Expiry 3.4 years(5) 3.6 years(5)
14
598 155 775 825 447 598
100 200 300 400 500 600 700 800 900 2012 2013 2014 2015 2016 2017 $’mn
(1) The debt weighted average term to expiry will extend to 3.4 years when the $598 million loans due for refinancing on 31 December 2012 are refinanced for 5 years to 2017. The actual debt weighted average term to expiry as at 30 September 2012 is 2.3 years.
15
16
100.0% 100.0% 100.0% 99.5% 95.0% 100.0% 97.4% 98.2% Bugis Junction Towers One Raffles Quay Prudential Tower MBFC Phase 1 Ocean Financial Centre 275 George Street 77 King Street Portfolio
Singapore core CBD occupancy at 93.2%(1)
(1) Source: CB Richard Ellis (2) Refers to Keppel REIT’s 92.8% interest
(2)
17
Long-Term Leases 45% Short-Term Leases 55%
Portfolio with Long-Term Leases(3) by NLA Weighted Average Lease Expiry (WALE) Top Ten Tenants WALE Portfolio WALE 7.5 years(1) 6.1 years(2)
(1) Including the acquisition of the Old Treasury Building office tower, the top ten tenants WALE will be 9.7 years. (2) Including the acquisition of the Old Treasury Building office tower, the portfolio WALE will be 7.2 years. (3) Long-term leases are those with lease terms to expiry of at least five years
18
0.0% 6.9% 4.4% 9.5% 17.7% 0.3% 7.1% 8.6% 10.4% 5.4% 2012 2013 2014 2015 2016
Portfolio Lease Profile (by NLA) as at 30 September 2012
Leases Expiring as a Percentage of Total Portfolio NLA Rent Reviews as a Percentage of Total Portfolio NLA
19
Accounting & consultancy services, 1.7% Banking, insurance & financial services, 51.7% Government agency, 2.7% Hospitality & leisure, 1.8% IT services & consultancy, 1.7% Others, 2.1% Real estate & property services, 6.1% Services, 4.3% Shipping & marine services, 0.3% Energy & natural resources, 9.4% F&B, 1.1% Legal, 7.8%
Telecommunications
& multi-media, 8.3% Retail (Exclude F&B and Services), 1.0% (1) Tenants with multiple leases are accounted as
20
7.8% 6.5% 5.8% 4.4% 3.6% 3.6% 3.5% 2.9% 2.8% 2.7% Australia and New Zealand Banking Group Ltd Standard Chartered Bank Telstra Corporation Limited Barclays Capital Service Limited Singapore Branch BNP Paribas Drew & Napier LLC Deutsche Bank Aktiengesellschaft BHP Billiton Marketing Asia Pte Ltd UBS AG International Enterprise Singapore
Top Ten Tenants
Ocean Financial Centre Marina Bay Financial Centre Phase 1 One Raffles Quay 275 George Street Bugis Junction Towers
21
Main lobby, lift cars, toilets
22
rs, toilets
Enhancement works at Bugis Junction Towers on track for completion in 1Q 2013
Main lobby, lift cars, toilets Main lobby, lift cars, toilets
rs on track for completion in 1Q 2013
23
24
Source: CB Richard Ellis.
25
$8.80 $8.10 $8.00 $8.45 $9.00 $9.90 $10.30 $10.60 $11.06 $11.00 $10.60 $10.10 $9.80 91.2% 91.2% 91.9% 93.3% 95.2% 95.3% 94.4% 93.1% 92.3% 91.2% 90.7% 91.6% 93.2% 20% 30% 40% 50% 60% 70% 80% 90% 100% $- $3 $6 $9 $12 $15 Sep-09 Dec-09 Mar-10 Jun-10 Sep-10 Dec-10 Mar-11 Jun-11 Sep-11 Dec-11 Mar-12 Jun-12 Sep-12 Core CBD Occupancy Average Grade A Office Rental ($ psf pm) Average Grade A Rental ($ psf pm) Core CBD Occupancy
multi-media businesses
the private sector and domestic consumption
26
27
Keppel REIT aims to be a successful commercial real estate investment trust with a sterling portfolio of assets pan-Asia.
To deliver stable and sustainable returns to Unitholders by continually enhancing our assets and expanding our portfolio.
28
29
(1) Tenants with multiple leases accounted as one tenant (2) Valuation as at 1 October 2011 based on Keppel REIT’s interest in the respective properties unless otherwise stated. (3) Refers to Keppel REIT’s one-third interest in Marina Bay Financial Centre Towers 1 & 2 and Marina Bay Link Mall. (4) Includes the acquisition of an additional 12.39% interest in Ocean Financial Centre (OFC) completed on 25 June 2012. (5) Based on the sum of the valuations of the 87.5% interest in OFC as at 15 September 2011 and the 12.39% interest in OFC as at 15 June 2012. (6) Based on the exchange rate of A$1 = S$1.285. (7) 8 Chifley Square currently under construction and expected to be completed in 3Q 2013. (8) Pre-committed lease. (9) Based on the lower acquisition consideration of A$154.4 million on completion and an exchange rate of A$1 = S$1.285. (10) The new office tower at the Old Treasury Building site is currently under construction and expected to be completed in the second half of 2015. (11) Tenure commencement based on estimated construction completion date. (12) Based on acquisition consideration of A$165 million and an exchange rate of A$1 = S$1.285.
Singapore Portfolio Australia Portfolio Bugis Junction Towers MBFC Interest (3) Ocean Financial Centre Interest One Raffles Quay Interest Prudential Tower Property 275 George Street Property 77 King Street Property 8 Chifley Square Interest (7) Old Treasury Building Office Tower Interest
(10)
Attributable NLA (sf) 244,978 581,776 885,684(4) 445,120 222,845 224,688 147,980 102,850 165,750 Ownership 100.0% 33.3% 99.9%(4) 33.3% 92.8% 50.0% 100.0% 50.0% 50.0% Number of tenants(1) 12 82 34 29 40 9 16 1 1 Principal tenants IE Singapore, InterContinental Hotels Group, Keppel Land Barclays Capital, BHP Billiton, Standard Chartered Bank ANZ, BNP Paribas, Drew & Napier LLC Royal Bank of Scotland, Deutsche Bank, UBS Prudential Assurance Company, The Executive Centre, UniCredit Bank Queensland Gas Company, Telstra Corporation Capgemini Australia, Hebert Geer, Drake Australia Corrs Chambers Westgarth (8) Government of Western Australia (8) Tenure 99 years expiring 9 Sep 2089 99 years expiring 10 Oct 2104 99 years expiring 13 Dec 2110 99 years expiring 12 Jun 2100 99 years expiring 14 Jan 2095 Freehold Freehold 99 years expiring 5 Apr 2105 99 years expiring second half of 2114(11) Valuation(2) (S$ million) 410.5 1,513.0 2,345.0(5) 1,099.0 477.4 231.3(6) 151.6(6) 198.4(9) 212.0(12) Committed
100.0% 99.5% 95.0% 100.0% 100.0% 100.0% 97.4% 40.0% 98.0%
30
Fax: 6835 7747 http://www.keppelreit.com For enquiries, please contact Ms Casiopia Low Investor Relations & Research Tel: 6433 7622 Email: casiopia.low@keppelreit.com
31