11 7 modeling cumulations
play

11/7:%Modeling%Accumulations The purpose of calculus is twofold: 1. - PDF document

11/7:%Modeling%Accumulations The purpose of calculus is twofold: 1. to find how something is changing, given what its doing; 2. to find what something is doing, given how its changing. We did (1) geometrically and algebraically. We did (2)


  1. 11/7:%Modeling%Accumulations The purpose of calculus is twofold: 1. to find how something is changing, given what it’s doing; 2. to find what something is doing, given how it’s changing. We did (1) geometrically and algebraically. We did (2) algebraically. Let’s do (2) geometrically! 
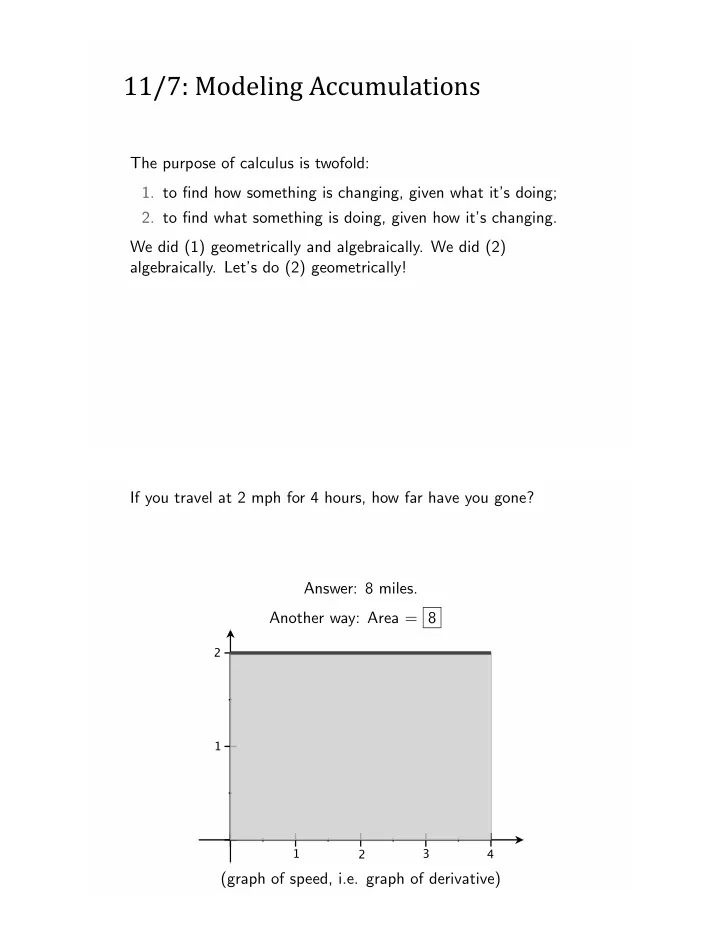
If you travel at 2 mph for 4 hours, how far have you gone? Answer: 8 miles. Another way: Area = 8 2 1 1 3 4 2 (graph of speed, i.e. graph of derivative)

  2. If you travel at 1 mph for 2 hours, and 2 mph for 2 hours, how far If you travel at have you gone? .5 mph for 1 hour, 1 mph for 1 hour, 1.5 mph for 1 hour, 2 mph for 1 hour, how far have you gone? Area = 2+4= 6 Area = . 5 + 1 + 1 . 5 + 2 = 5 2 2 1 1 1 3 4 1 3 4 (graph of speed, i.e. graph of derivative) (graph of speed, i.e. graph of derivative) If you travel at 1 If you travel at 2 t mph for 2 hours, how far have you gone? .175 mph for 1/4 hour, .25 mph for 1/4 hour, . . . 2 mph for 1/4 hour, how far have you gone? Area = . 175 ∗ . 25 + . 25 ∗ . 25 + · · · + 2 ∗ . 25 = 4.25 Area = 4 (it’s a triangle) 2 2 1 1 1 3 4 1 3 4 (graph of speed, i.e. graph of derivative) (graph of speed, i.e. graph of derivative)

  3. Estimate the area under the curve 8 x 2 between x = 0 and x = 4: y = 1 Area = ??? 2 1 1 2 3 4 Estimate the area under the curve 8 x 2 between x = 0 and x = 4: y = 1 Estimate 1: pick the highest point Area ≈ 8 2 1 1 2 3 4

  4. Estimate the area under the curve Estimate the area under the curve 8 x 2 between x = 0 and x = 4: 8 x 2 between x = 0 and x = 4: y = 1 y = 1 Estimate 2: pick two points Estimate 3: pick four points Area ≈ 1 8 + 1 2 + 9 8 + 2 = 3.75 Area ≈ 1+4 = 5 2 2 1 1 1 2 3 4 1 3 4 2 Estimate the area under the curve Estimate the area under the curve 8 x 2 between x = 0 and x = 4: 8 x 2 between x = 0 and x = 4: y = 1 y = 1 Estimate 4: pick eight points Estimate 5: pick sixteen points 32 ∗ 1 1 2 + 1 8 ∗ 1 2 + · · · + 2 ∗ 1 Area ≈ 2 = 3.1875 Area ≈ 2.921875 2 2 1 1 1 2 3 4 1 3 4 2

  5. Estimating the Area of a Circle with r = 1 Estimating the Area of a Circle with r = 1 Divide it up into rectangles: Divide it up into rectangles: √ 1 − x 2 ) and mult. by 2. Estimate area of the half circle ( f ( x ) = 1 height = f(0) = 1 1 A=1 -1 0 1 height = f(1) = 0 -1 0 1 base=1 base=1 # rect. Area 4 2*1 = 2 4*2 -1 4*3 4*4 4*5 1 1 -1 0 1 -1 0 1

  6. The Method of Accumulations Big idea: Estimating, and then taking a limit. Let the number of pieces go to ∞ i.e. let the base of the rectangle for to 0. This not only gives us a way to calculate, but gives us a proper definition of what we mean by area! Also good for volumes and lengths... A small dam breaks on a river. The average flow out of the stream is given by the following: m 3 / s m 3 / s m 3 / s hours hours hours 0 150 4.25 1460 8.25 423 0.25 230 4.5 1350 8.5 390 0.5 310 4.75 1270 8.75 365 0.75 430 5 1150 9 325 1 550 5.25 1030 9.25 300 1.25 750 5.5 950 9.5 280 1.5 950 5.75 892 9.75 260 1.75 1150 6 837 10 233 2 1350 6.25 770 10.25 220 2.25 1550 6.5 725 10.5 199 2.5 1700 6.75 658 10.75 188 2.75 1745 7 610 11 180 3 1750 7.25 579 11.25 175 3.25 1740 7.5 535 11.5 168 3.5 1700 7.75 500 11.75 155 3.75 1630 8 460 12 150 4 1550

  7. A small dam breaks on a river. The average flow out of the stream is given by the following: 1500 1000 500 -1 0 1 2 3 4 5 6 7 8 9 10 11 12 13 Over each time interval, we estimate the volume of water by Average rate × 900 s V = 1500m 3 /s*900s 1500 1000 500 2.25 2.5 2.75

  8. Over each time interval, we estimate the volume of water by Average rate × 900 s 1500 1000 500 -1 0 1 2 3 4 5 6 7 8 9 10 11 12 13 Over each time interval, we estimate the volume of water by Average rate × 900 s m 3 m 3 m 3 hours hours hours 0 135000 4.25 1314000 8.25 380700 0.25 207000 4.5 1215000 8.5 351000 0.5 279000 4.75 1143000 8.75 328500 0.75 387000 5 1035000 9 292500 1 495000 5.25 927000 9.25 270000 1.25 675000 5.5 855000 9.5 252000 1.5 855000 5.75 802800 9.75 234000 1.75 1035000 6 753300 10 209700 2 1215000 6.25 693000 10.25 198000 2.25 1395000 6.5 652500 10.5 179100 2.5 1530000 6.75 592200 10.75 169200 2.75 1570500 7 549000 11 162000 3 1575000 7.25 521100 11.25 157500 3.25 1566000 7.5 481500 11.5 151200 3.5 1530000 7.75 450000 11.75 139500 3.75 1467000 8 414000 12 135000 4 1395000 total=33,319,800

  9. A tent is raised and has height given by xy over the 2 × 2 grid where 0 < x < 2 and 0 < y < 2. What is the volume of the tent? A tent is raised and has height given by xy over the 2 × 2 grid where 0 < x < 2 and 0 < y < 2. What is the volume of the tent? Estimate via boxes! Volume = base *height. 2 height = xy volume x y 0 0 0 0 * 1 0 1 0 0 * 1 1 0 0 0 * 1 1 1 1 1 1 * 1 total volume ≈ 1 0 1 2

  10. A tent is raised and has height given by xy over the 2 × 2 grid where 0 < x < 2 and 0 < y < 2. What is the volume of the tent? Estimate via boxes! Volume = base *height. 2 height = xy volume x y 1 1 1 1 * 1 1 2 2 2 * 1 2 1 2 2 * 1 1 2 2 4 4 * 1 total volume ≈ 9 0 1 2 A tent is raised and has height given by xy over the 2 × 2 grid where 0 < x < 2 and 0 < y < 2. What is the volume of the tent? Estimate via boxes! Volume = base *height. 2 height = xy volume x y .5 .5 .25 .5 * 1 .5 1.5 .75 .75 * 1 1.5 .5 .75 .75 * 1 1 1.5 1.5 2.25 2.25 * 1 total volume ≈ 4.25 0 1 2

Download Presentation
Download Policy: The content available on the website is offered to you 'AS IS' for your personal information and use only. It cannot be commercialized, licensed, or distributed on other websites without prior consent from the author. To download a presentation, simply click this link. If you encounter any difficulties during the download process, it's possible that the publisher has removed the file from their server.

Recommend


More recommend