
1
ME 499-699 Fall 2006 Slides 7 -1More info: “Materials Selection in Mechanical Design”, Chapters 7 and 8
Process Selection
Processes and their attributes The selection strategy Screening by attributes Ranking by economic criteria Case study + demos
ME 499-699 Fall 2006 Slides 7 -2Manufacturing processes
The text book classified manufacturing processes into three broad
categories
- Shaping
- Joining
- Surface treatment
Each has many sub-categories, which may then be further subdivided
into individual processes
Many processes are used in combination with others
- Manufacturing process selection involves identifying which will
work best for a particular application
ME 499-699 Fall 2006 Slides 7 -3Examples of processes
Sand casting
Shaping
Blow moulding
Shaping
Fusion welding
Joining
Induction hardening
Surface treating
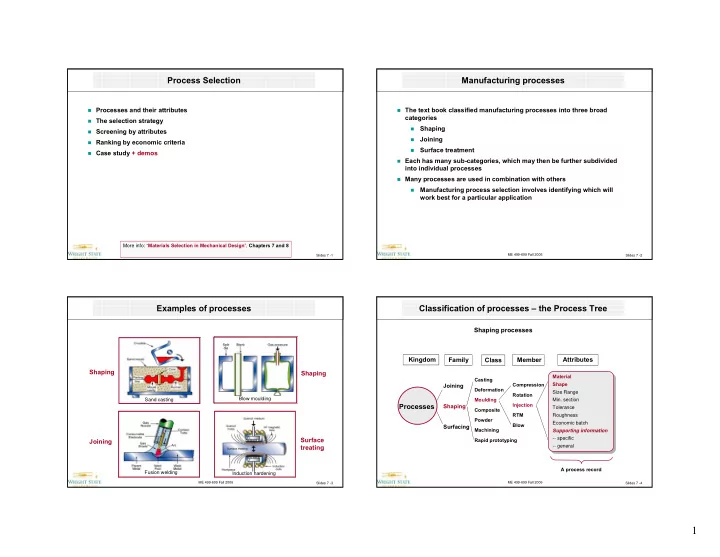
ME 499-699 Fall 2006 Slides 7 -4Classification of processes – the Process Tree
Family
Joining Shaping Surfacing
Class
Casting Deformation Moulding Composite Powder Machining Rapid prototyping
Member
Compression Rotation Injection RTM Blow
Attributes
A process record Material Shape Size Range
- Min. section
Tolerance Roughness Economic batch Supporting information
- - specific
- - general
Material Shape Size Range
- Min. section
Tolerance Roughness Economic batch Supporting information
- - specific
- - general
Kingdom
Processes
Shaping processes