1 1.Variation in the Wedge between Social and Private Returns 1. - - PowerPoint PPT Presentation

1
SMART_READER_LITE
LIVE PREVIEW

1 1.Variation in the Wedge between Social and Private Returns 1. - - PowerPoint PPT Presentation

1. Why do Governments Have R&D Outline and Innovation Policies? 1. Economic rationale for government support of Social return to R&D>Private return => private The Economics of R&D Tax private R&D. sector


slide-1
SLIDE 1

1

The Economics of R&D Tax Credits

Professor Bronwyn H. Hall University of California at Berkeley Oxford University

3/21/01 Economics of R&D Credits 2

Outline

  • 1. Economic rationale for government support of

private R&D.

  • 2. Trends in government support of private R&D:

direct spending and tax incentives.

  • 3. Structure of existing R&D credit.
  • 4. Effectiveness of existing R&D credit.
  • 5. Comparison of U.S. taxation of R&D with other

major industrial countries.

  • 6. Policy issues

3/21/01 Economics of R&D Credits 3

  • 1. Why do Governments Have R&D

and Innovation Policies?

  • Social return to R&D>Private return => private

sector underprovision. Some reasons for this:

– Difficult to evaluate and fund some kinds of research.

  • External finance means revealing ideas.
  • Benefits so diffuse recipients hard to organize or identify.
  • Need large organization for implementation/commercialization

but such organizations not necessarily good innovators.

  • Standards-related R&D - public goods nature of standards.

– National security and/or strategic industries

  • “ripe” for technical advance.
  • closely linked to other industries.
  • enables progress in many other industries (e.g., semiconductors).

3/21/01 Economics of R&D Credits 4

  • 1. Why do Governments Have R&D

and Innovation Policies? (cont.)

– Education/human capital and imperfect capital markets.

  • Individuals face differing financial constraints in

investing in human capital - equality of opportunity argues in favor of education subsidies.

  • Externalities for society from human capital

formation by individuals (assuming they do not capture all the benefits in their wages).

3/21/01 Economics of R&D Credits 5

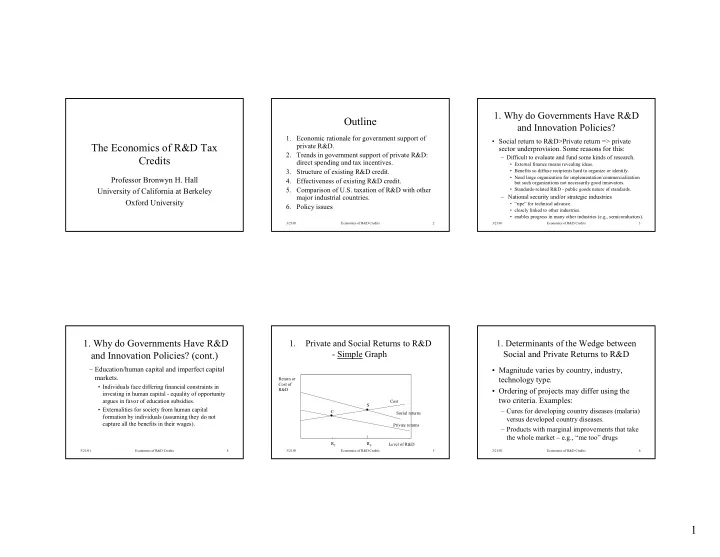
1. Private and Social Returns to R&D

  • Simple Graph

Level of R&D Return or Cost of R&D Cost Social returns Private returns C S RC RS

3/21/01 Economics of R&D Credits 6

  • 1. Determinants of the Wedge between

Social and Private Returns to R&D

  • Magnitude varies by country, industry,

technology type.

  • Ordering of projects may differ using the

two criteria. Examples:

– Cures for developing country diseases (malaria) versus developed country diseases. – Products with marginal improvements that take the whole market – e.g., “me too” drugs

slide-2
SLIDE 2

2

3/21/01 Economics of R&D Credits 7

  • 1. Determinants of the Wedge between

Social and Private Returns to R&D

Types of research vary greatly in returns:

  • 1. “Pure” science:

– Bohr - quantum mechanics – basic genome mapping.

  • 2. Goal-oriented applied research:

– Edison - light bulb/ phonograph – New electric batteries.

  • 3. Scientific discoveries from solving practical problems:

– Pasteur - bacteriology via wine research – Mathematics via encryption research.

3/21/01 Economics of R&D Credits 8

Basic research

Social return Private return Cost

Development

Social return Private return Cost

1.Variation in the Wedge between Social and Private Returns

3/21/01 Economics of R&D Credits 9

  • 1. Economists’ Solutions to Market

Failures

  • Internalize the externality:

– Research joint ventures between firms – Create a property right (patents or other IPR) Problem: may give monopoly power, reduce output.

  • Subsidize the activity; reduce its cost.
  • Tax the activity (in this case, a credit)
  • Regulation (not very effective in this case)?

– Price controls (wage controls on S&E?) – Quotas - mandating R&D performance

3/21/01 Economics of R&D Credits 10

  • 1. Subsidizing R&D
  • Direct government subsidy:

– science/basic research – education – defense/space – health

  • Tax policy:

– R&D is expensed - faster than economic depreciation. – R&E tax credit (federal and some states) – focus today. – Returns to foreign R&D repatriated at low tax rates.

3/21/01 Economics of R&D Credits 11

  • 1. The Tradeoff
  • Who chooses projects better, government or

industry? targeted subsidies vs. broad credits.

  • Who performs projects better, government or

industry? direct spending vs. subsidy or credit

  • Politics?

– Which part of the budget? – Which congressional district benefits?

3/21/01 Economics of R&D Credits 12

  • Total R&D Spending in the United States

1953-2000

$0 $50,000 $100,000 $150,000 $200,000 $250,000 $300,000 1953 1956 1959 1962 1965 1968 1971 1974 1977 1980 1983 1986 1989 1992 1995 1998 Year Millions of 1996$ Federal R&E Tax Credit

  • Federal R&D Spending
  • Industry R&D Spending
  • Other R&D Spending
slide-3
SLIDE 3

3

3/21/01 Economics of R&D Credits 13

  • R&D Spending in the United States as a Share of GDP

1953-2000

0.0% 0.5% 1.0% 1.5% 2.0% 2.5% 3.0% 3.5% 1953 1956 1959 1962 1965 1968 1971 1974 1977 1980 1983 1986 1989 1992 1995 1998 Year Share in Percent

  • Federally-funded R&D
  • Industry-funded R&D

U&C/Non-profit funded R&D

3/21/01 Economics of R&D Credits 14

R&D to GDP Shares - G7 Economies 1981-1999

0.0% 0.5% 1.0% 1.5% 2.0% 2.5% 3.0% 3.5% 1981 1982 1983 1984 1985 1986 1987 1988 1989 1990 1991 1992 1993 1994 1995 1996 1997 1998 1999 Year Share in Percent U Ja G Fr U Ita Ca

3/21/01 Economics of R&D Credits 15

  • 3. R&E Tax Credit
  • Introduced in July 1981; continuously tinkered

with and renewed through 2004, with the exception of one year in 1995-96, when it lapsed.

  • Components:

1) Regular credit (20% of incremental spending) OR Alternative incremental R&E credit (lower base, lower rate) 2) Basic research credit

  • Reduced by the corporate tax rate (recaptured on

expensed R&D) – implies actual credit ~ 65% of computed credit.

3/21/01 Economics of R&D Credits 16

  • 3. Regular R&E Tax Credit

As of July 1996, the R&D tax credit is generally computed based

  • n the following formula:

20% x (QRE - BA) + 20% x (Basic) The Base Amount (BA) is the Fixed Base Percentage (FB) times average annual gross receipts for the preceding 4 tax years. BA cannot be less than 50% of the taxpayer’s Qualified Research Expenses (QRE) for the current tax year. FB is the ratio of the taxpayer’s QRE for the base period of 1984 through 1988 to gross receipts for the same period. This percentage may not exceed 16%. For start-up companies (as specially defined for the credit), FB is generally 3%.

3/21/01 Economics of R&D Credits 17

  • 3. Regular R&E Tax Credit
  • Qualified research expenditure – “research in the laboratory
  • r for experimental purposes, undertaken for discovering

information, technological in nature, application is intended to be useful in the development of a new or improved business component for the taxpayer, whether carried on by the taxpayer or on behalf of the taxpayer by a third party.”

– In practice, QRE is about 62-65% of R&D spending – definition is the source of substantial IRS auditing headaches. – Credit is 65% of amounts paid to a third party, increased to 75% if third party a qualified research consortium. – Excludes software development for internal use by the firm.

  • Basic research - “original investigation for the advancement
  • f scientific knowledge not having a specific commercial
  • bjective.”

3/21/01 Economics of R&D Credits 18

  • 3. Why an Incremental Credit?

Rate of Return or Cost of R&D

Amount of R&D ! R0 R1

Tax revenue loss for incremental credit Tax revenue loss for ordinary credit Effective cost of capital

slide-4
SLIDE 4

4

3/21/01 Economics of R&D Credits 19

  • 3. Marginal Cost of R&D

Sample computation for 1981 through 1989 Tax price = 1- (TI) • τ • (1+r)-J – φ φ = ρ ((1+r)-s Z – (1/3) [(1+r)-(1+J(+1))(Z+1>0.5) + [(1+r)-

(2+J(+2))(Z+2>0.5) + [(1+r)-(3+J(+3))(Z+3>0.5)]

where

TI = whether firm has taxable income τ = corporate tax rate φ = effective credit rate r = interest rate ρ = statutory credit rate Z = 0,1,2, depending on QRE rel. to FB

J = number of years until loss carryforward exhausted (usually zero) s = +/- number of years credit carried forward or back

3/21/01 Economics of R&D Credits 20

  • 3. Distribution of the Effective Marginal

Tax Rate across U.S. Firms

  • 25.0
  • 20.0
  • 15.0
  • 10.0
  • 5.0

0.0 5.0 10.0 15.0 20.0 25.0 30.0 1980 1981 1982 1983 1984 1985 1986 1987 1988 1989 1990 1991 Year Percent 5th percentile 95th percentile Median First quartile Third quartile

3/21/01 Economics of R&D Credits 21

  • 3. Alternative R&E Tax Credit (AIRC)
  • The alternative credit has a lower base and

also a lower rate of credit:

3.75% >2.0% 3.20% 1.5-2.0% 2.65% 1.0-1.5 % Alternative credit rate QRE to 4-yr average sales

3/21/01 Economics of R&D Credits 22

  • 3. Analysis of AIRC

Rate of Return or Cost of R&D

Amount of R&D !

QRE R0 R1 Tax revenue loss for incremental credit

3/21/01 Economics of R&D Credits 23

  • 3. Typical AIRC Users
  • Defense contractors (because defense spending for R&D

has fallen since the 1980s).

  • Companies whose sales are growing more rapidly than

R&D because

– less R&D-intensive lines of business are growing faster than other lines of business – a blockbuster product was discovered during or after the base period.

  • Companies that have achieved large productivity increases

in their R&D activities due to new technology.

  • Companies that have reduced R&D budgets to cut costs.

Source: Peter Merrill, private communication.

3/21/01 Economics of R&D Credits 24

  • 4. Effectiveness of existing R&D credit.
  • How to evaluate?

– Difficult if not impossible:

  • Was the gap closed? private = social return at
  • ptimal level of social R&D.

– Usual method:

  • Benefit (increased industrial R&D) = Cost (loss of

tax revenue).

– Compare to subsidy “effects” on private R&D spending.

slide-5
SLIDE 5

5

3/21/01 Economics of R&D Credits 25

  • 4. Sampling of Major Studies
  • Mansfield (fairly early, 1984) – found little effect
  • n firm R&D using surveys and small sample.
  • Baily and Lawrence (1992, time series/cross

industry) – unit elasticity. 1 percent R&D increase per 1 percent fall in cost.

  • Hall (1993) – first properly done firm-level study

– elasticity>1; revenue loss<induced R&D.

  • Bloom, Griffith, Van Reenen (1997) – cross-

country study finds elasticity about 1.

  • Hall and Van Reenen (RP 2000) – survey of

results, including other countries.

3/21/01 Economics of R&D Credits 26

0% 10% 20% 30% 40% 50% 60% 70% 80% 1953 1956 1959 1962 1965 1968 1971 1974 1977 1980 1983 1986 1989 1992 1995 1998 Year Percentage Federal R&D Spending Share Federal R&D Credit Tax Expenditure

  • 4. Federal Share of Total R&D (U. S.)

3/21/01 Economics of R&D Credits 27

  • 5. Comparison of U.S. taxation of R&D

with other major industrial countries

Country R&D Deprec. Tax Credit Base for Carryback and Credit Foreign R&D by (Date Enacted) Rate Rate

  • Inc. Tax Credit

Carryforw ard Taxable? by Domestic Firms Canada 100% 20% 3 yr CB yes expense (1960s) 10 yr CF no ITC, etc. France 100% 50% (R(-1)+R(-2))/2 5-yr CF; 5 yr for OL no no accel dep (1983)

  • r 5 yr amort.

(real) TC refunded recapture no credit Germany 100% none NA 1/5 yrs NA

  • amort. If acq.

Italy 100% none NA NA ? NA

  • r 5 yr amort.

Japan 100% 20% (max at max R since 66 5-yr usual but no 6% credit for coop (1966)

  • r 5 yr amort.

10% tax liab.) credit limited to 10% w ith foreign labs UK 100% none NA 5-yr CF NA US 100% 20% avg of 84-88 R 3/15 yrs yes not eligible (July 1981)

  • r 5 yr amort.

changed to 1/20 in 97

3/21/01 Economics of R&D Credits 28

  • 5. Comparison of U.S. taxation of R&D

with other major industrial countries

  • All countries allow expensing; fast depreciation of R&D

capital equipment.

– US, Canada, Japan, and France have a tax credit in addition. – in most cases it can be carried back at least 3 years and forward at least 5 years. – US, France, and Canada require recapture of expense deduction.

  • Foreign R&D done by domestic firms usually not eligible

for the credit – incoming royalties generally taxed by host country at between 0 and 10%.

  • Domestic R&D done by foreign firms – outgoing royalties

generally taxed at between 0 and 10%.

3/21/01 Economics of R&D Credits 29

Source: Hall and Van Reenen (2001)

0.40 0.50 0.60 0.70 0.80 0.90 1.00 1.10 1979 1980 1981 1982 1983 1984 1985 1986 1987 1988 1989 1990 1991 1992 1993 1994 Year Price of R&D Relative to Output Canada Australia USA France Japan U.K. Germany Italy

  • 5. After-tax Cost of $1 of R&D

3/21/01 Economics of R&D Credits 30

  • 6. Some Open Policy Issues
  • Permanence – is 5 years permanent for a

biotech firm?

  • “Relabeling” – it may happen, but how

much of the increase is due to that effect?

  • Definition of “qualified” expenditure –

administrative and IRS audit costs.

  • Software costs (internal vs. external)