SLIDE 1
1
Statistics and analytical issues: SNP and haplotype
Linda Broer (l.broer@erasmusmc.nl) Genetic Laboratory Department of Internal Medicine Erasmus MC, Rotterdam
Overview
Sampling Effect estimation Hardy-Weinberg Equilibrium Linkage Disequilibrium Haplotypes
Overview
Sampling Effect estimation Hardy-Weinberg Equilibrium Linkage Disequilibrium Haplotypes
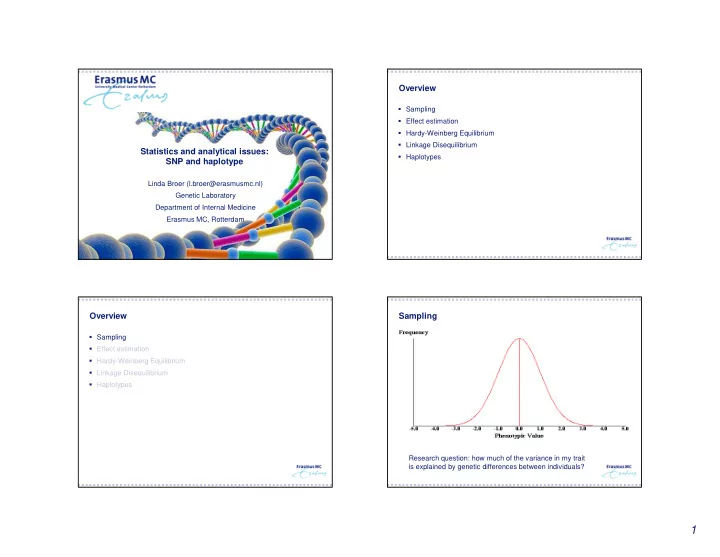
Sampling
Research question: how much of the variance in my trait is explained by genetic differences between individuals?
SLIDE 2
2
Sampling
Question to you: which samples do you select for your study?
Sampling
Important to take samples representative of source population!
Sampling
What about case/control studies? Osteoporosis Breast Cancer Coronary Heart Disease Etc. Your selected cases must represent cases from source population Your selected controls must represent the source population
Sampling in practice: the Rotterdam Study
Objective: to study health and disease in an elderly population We want an area in Rotterdam where individuals are mostly of European ancestry and are relatively old. Look up in public registries information about districts in Rotterdam. Ommoord < 10% not of European ancestry > 60% are 45+ years old Who to sample?
SLIDE 3
3
Sampling in practice: the Rotterdam Study Sampling in practice: the Rotterdam Study Sampling in practice: one more example
You want to study the development of children, starting before birth Where would you look for your study population? Gynaecologist Whom would you include? All pregnant women entering the clinic between set time points (e.g., 1 year)
Overview
Sampling Effect estimation Hardy-Weinberg Equilibrium Linkage Disequilibrium Haplotypes
SLIDE 4 4
Effect estimation in case/control studies
Odds of Allele + in cases = a/c Odds of Allele + in controls = b/d Thus Odds ratio (OR) =
⁄ = ∗ ∗
Cases Controls Total Allele +
a b
a + b Allele -
c d
c + d a + c b + d a + b + c + d
Effect estimation in case/control studies
Odds ratio (OR) =
⁄ = ∗ ∗
No association: OR = 1 Association: OR ≠ 1 OR > 1: increased risk OR < 1: decreased risk (protective)
Cases Controls Total Allele +
a b
a + b Allele -
c d
c + d a + c b + d a + b + c + d
Effect estimation in case/control studies
Example: 122 cases, 1428 controls 73 cases did not have the risk allele, while 49 did have the risk allele 1204 controls did not have the risk allele, while 224 did Let’s fill in the formula
Effect estimation in case/control studies
Odds ratio (OR) =
⁄ ⁄
=
∗ ∗ = 3.6
Carriers of this variant have an increased risk for the disease
Cases Controls Total Allele +
49 224
273 Allele -
73 1204
1277 122 1428 1550
SLIDE 5 5
Effect estimation in continuous traits
Compare mean values across genetic groups 0.74 0.76 0.78 0.80 0.82 SNP Mean BMD g/cm2 AA AG GG
Effect estimation and genetic model
Additive model: every additional allele increases your trait Most often tested in genetic studies Recessive model: only if you have two risk alleles you have increased trait Dominant model: your trait is increases with the same amount for one
Overview
Sampling Effect estimation Hardy-Weinberg Equilibrium Linkage Disequilibrium Haplotypes
Hardy-Weinberg Equilibrium (HWE)
In a population, allele and genotype frequencies will remain constant
Assumptions: Large population Random mating No new mutations No natural selection No migration Adequate genotyping
SLIDE 6 6
Hardy-Weinberg Equilibrium (HWE)
Controls represent the general population Thus must be in HWE! What if they are not? Most likely genotyping error occurred in lab. Can’t use the data! Cases can be out of HWE. Why? Usually at or near the disease-causing variant Rest of genome should be in HWE!
Hardy-Weinberg Equilibrium (HWE)
Variant with 2 alleles (A and B) Frequency of allele A = p Frequency of allele B = q Thus: + = 1 Punnett square of AB x AB crossing Results in the formula for HWE Thus: + 2 + = 1
Genotype Formula AA p2 AB 2pq BB q2 A B A p2 pq B pq q2
Hardy-Weinberg Equilibrium (HWE)
Example =
= 0.30 = 0.55 and = 1 − 0.55 = 0.45 Let’s calculate HWE
Genotype N AA (p2) 30 AB (2pq) 50 BB (q2) 20
Hardy-Weinberg Equilibrium (HWE)
+ 2 + = 1: Use to calculate expected numbers Chi2 = 0.01 (1 degree of freedom) P-value = 0.92 This population is in HWE!
Genotype Observed Expected (O-E)2/E AA 30 0.552*100 = 30.25 0.002 AB 50 2*0.45*0.55*100=49.5 0.005 BB 20 0.452*100=20.25 0.003
SLIDE 7
7
HWE: another example
Population of cats (n=100) 16 white & 84 black White is a recessive trait (bb) Black cats are BB and Bb What are the genotype frequencies in this population of cats? White cats: = 0.16 Therefore: = 0.16 = 0.4 Thus: = 1 − = 1 − 0.4 = 0.6 Frequency of BB: = 0.6 = 0.36 Frequency of Bb: 2 = 2 ∗ 0.6 ∗ 0.4 = 0.48
Overview
Sampling Effect estimation Hardy-Weinberg Equilibrium Linkage Disequilibrium Haplotypes
Mendel’s law of independent assortment
Each pair of alleles segregates independently of the other pairs and all possible combinations of alleles can occur in the resulting gametes More simply put: two SNPs (or traits) will inherit independently
What is linkage disequilibrium (LD)?
Mendel got lucky! LD: co-occurrence of alleles at adjacent loci more frequently than expected by the allele frequencies and recombination rate
SNP2 SNP1 SNP3
SLIDE 8 8
What is the use of knowing about LD?
Currently ~60 Million SNPs known in human genome Latest array ‘only’ measures 5 Million SNPs Is your disease causing SNP
- ne of the 5 Million measured?
D (SNP, DIP, CNV) M1 (SNP1) M2 (SNP2)
Where does LD come from?
Alleles that exist in the population today arose through ancient mutation events Before mutation A T A After mutation 1 G mutation T T After mutation 2 A T G T G C mutation
Where does LD come from?
Recombination generates new arrangements of ancestral alleles Before recombination A T G T G C After recombination C A T G T G C A
Recombination?
Recombination is NOT random Hot spots In between hot spots, variants are in LD They are correlated Often measured as r2 R2 = 1 : two variants provide same information
SLIDE 9 9
Overview
Sampling Effect estimation Hardy-Weinberg Equilibrium Linkage Disequilibrium Haplotypes
What is a haplotype?
combination of alleles at multiple loci that are transmitted together on the same chromosome Region in LD
Present-day Ancestor
Genotype or haplotype?
SNP1 SNP2 SNP3 SNP4 SNP5 SNP6
A C T A C T G A C G A C
Genotype Haplotype
Maternal chr Paternal chr
Genetic variation is structured in blocks of high LD
SLIDE 10 10
How to use haplotypes
Tags: SNP 1 SNP 3 SNP 6 3 in total Test for association: SNP 1 SNP 3 SNP 6
A/T 1 G/A 2 G/C 3 T/C 4 G/C 5 A/C 6
high r2 high r2 high r2
A A T T G C C G G C C G T C C C A C C C G C C G T C C C G G A A G G A A
After Carlson et al. (2004) AJHG 74:106
How to use haplotypes
Tags: SNP 1 SNP 3 2 in total Test for association: SNP 1 captures 1+2 SNP 3 captures 3+5 “AG” haplotype captures SNP 4+6
A A T T G C C G G C C G T C C C A C C C G C C G T C C C G G A A G G A A A C C C
A/T 1 G/A 2 G/C 3 T/C 4 G/C 5 A/C 6
How to use haplotypes: imputations
Correlation between variants used to ‘guess’ what the genotype of untyped variants is
So where do these reference haplotypes come from?
Large sample collections genotyped/sequenced previously HapMap 1000 Genome Project Local sequencing projects UK10K GoNL … Haplotype Reference Consortium
SLIDE 11
11
So where do these reference haplotypes come from? What about haplotypes themselves?
APOE and Alzheimer’s Disease
In summary / Take Home Messages
Sampling must be representative of source population Additive model is primary model for effect estimation Hardy-Weinberg Equilibrium mostly warns you about genotyping errors Linkage Disequilibrium is the correlation between adjacent loci Haplotypes are the combination of alleles on adjacent loci Haplotypes are used for imputations Don’t forget that haplotypes themselves can also influence phenotypes
Questions