
SLIDE 1
- 1
filename 1
Using R for Evaluating Trading Using R for Evaluating Trading Strategies Strategies
Patrick Burns Patrick Burns http://www.burns http://www.burns-
- stat.com
stat.com
June 2006 June 2006
filename 2
Summary Summary
- R is a good thing
R is a good thing
- Random portfolios are useful
Random portfolios are useful
- More information at
More information at http://www.burns http://www.burns-
- stat.com
stat.com
filename 3
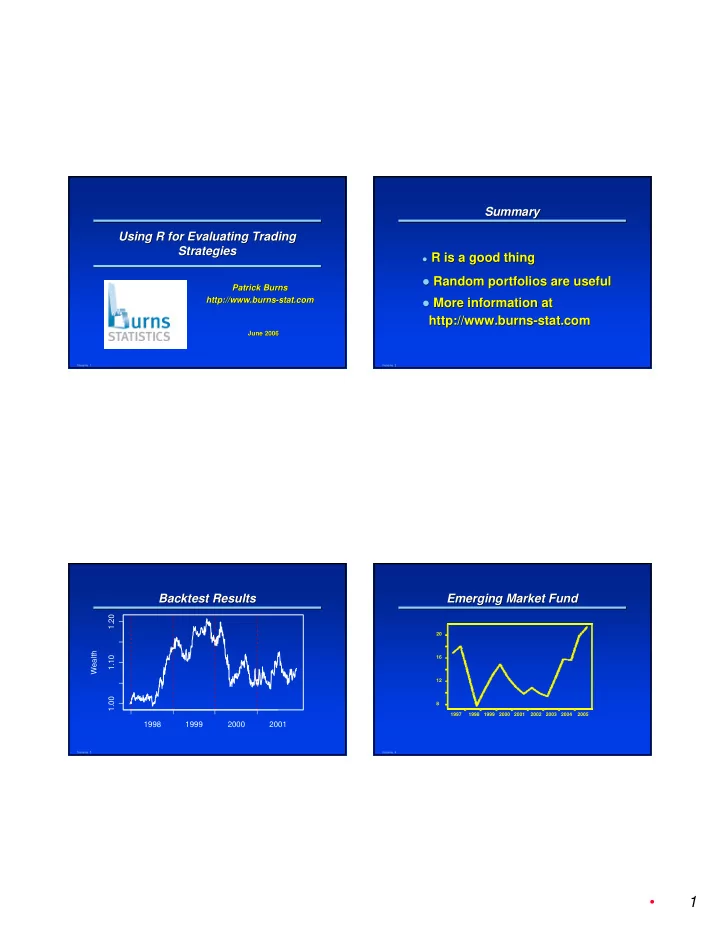
Backtest Backtest Results Results
Wealth 1.00 1.10 1.20 1998 1999 2000 2001
filename 4
Emerging Market Fund Emerging Market Fund
1997 1998 1999 2000 2001 2002 2003 2004 2005 20 16 12 8