
1
Capacity of Ad Hoc Networks
Quality of Wireless links Quality of Wireless links
Physical Layer Issues
Physical Layer Issues
The Channel Capacity
The Channel Capacity
Path Loss Model and Signal Degradation
Path Loss Model and Signal Degradation
802.11 MAC for Ad-hoc Networks 802.11 MAC for Ad-hoc Networks
DCF (Distributed Coordination Function)
DCF (Distributed Coordination Function)
Analysis of Network Capacity Analysis of Network Capacity
Enhancement Of Network Capacity Enhancement Of Network Capacity
Physical Layer Issues
Bandwidth of 802.11 Bandwidth of 802.11 b/g b/g
upto
upto 30 MHz, centered at 2.4GHz 30 MHz, centered at 2.4GHz
Data Rates Data Rates
802.11 b : 11Mbps (~5.5 Mbps practically)
802.11 b : 11Mbps (~5.5 Mbps practically)
802.11 g : 54Mbps (~35 Mbps practically)
802.11 g : 54Mbps (~35 Mbps practically)
Layer 1 Capacity
Theoretical Upper bound Theoretical Upper bound C = C = W Wc
c log ( 1 +log ( 1 + SNR/W SNR/Wc ) bits/sec ) bits/sec
Where Where Wc
c : Bandwidth in Hz: Bandwidth in Hz
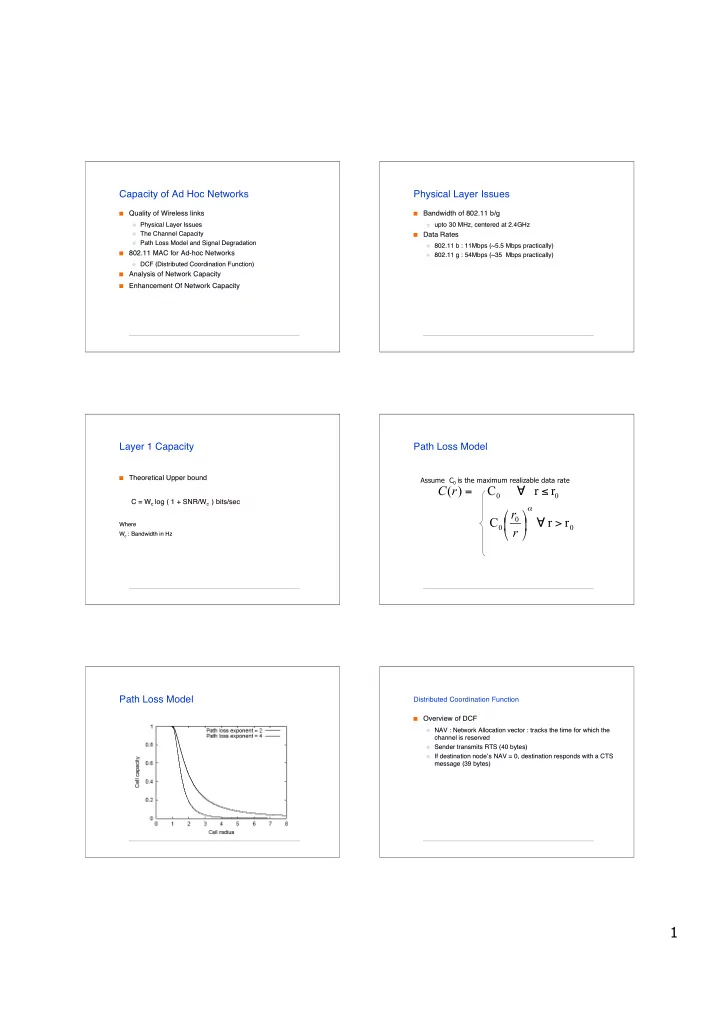
Path Loss Model
Assume C0 is the maximum realizable data rate
r r C r r C ) ( > ! " # $ % & ' ( ! =
)
r r r C
Path Loss Model
Distributed Coordination Function
Overview of DCF Overview of DCF
NAV : Network Allocation vector : tracks the time for which the
NAV : Network Allocation vector : tracks the time for which the channel is reserved channel is reserved
Sender transmits RTS (40 bytes)
Sender transmits RTS (40 bytes)
If destination node
If destination nodeʼs NAV = 0, destination responds with a CTS s NAV = 0, destination responds with a CTS message (39 bytes) message (39 bytes)