
SLIDE 1
1
4/30/2003
- R. Crawfis, Ohio State Univ.
52
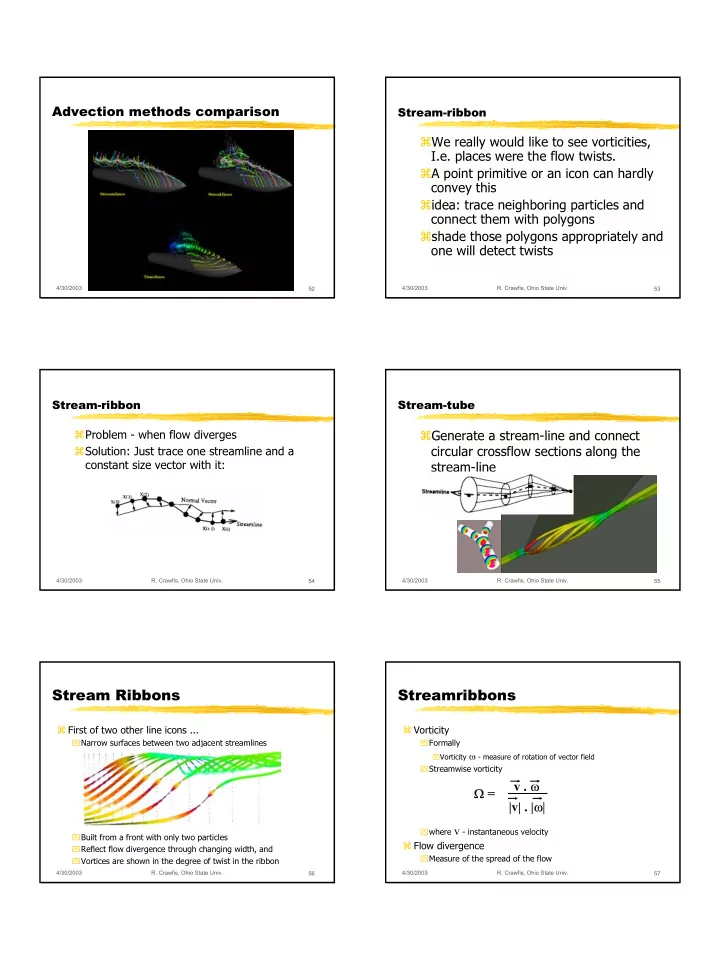
Advection methods comparison
4/30/2003
- R. Crawfis, Ohio State Univ.
53
Stream-ribbon
We really would like to see vorticities, I.e. places were the flow twists. A point primitive or an icon can hardly convey this idea: trace neighboring particles and connect them with polygons shade those polygons appropriately and
- ne will detect twists
4/30/2003
- R. Crawfis, Ohio State Univ.
54
Stream-ribbon Problem - when flow diverges Solution: Just trace one streamline and a constant size vector with it:
4/30/2003
- R. Crawfis, Ohio State Univ.
55
Stream-tube
Generate a stream-line and connect circular crossflow sections along the stream-line
4/30/2003
- R. Crawfis, Ohio State Univ.
56
First of two other line icons ...
Narrow surfaces between two adjacent streamlines Built from a front with only two particles Reflect flow divergence through changing width, and Vortices are shown in the degree of twist in the ribbon
Stream Ribbons
4/30/2003
- R. Crawfis, Ohio State Univ.
57
Vorticity
Formally
⌧Vorticity ω - measure of rotation of vector field
Streamwise vorticity where v - instantaneous velocity
Flow divergence
Measure of the spread of the flow