
SLIDE 1
1
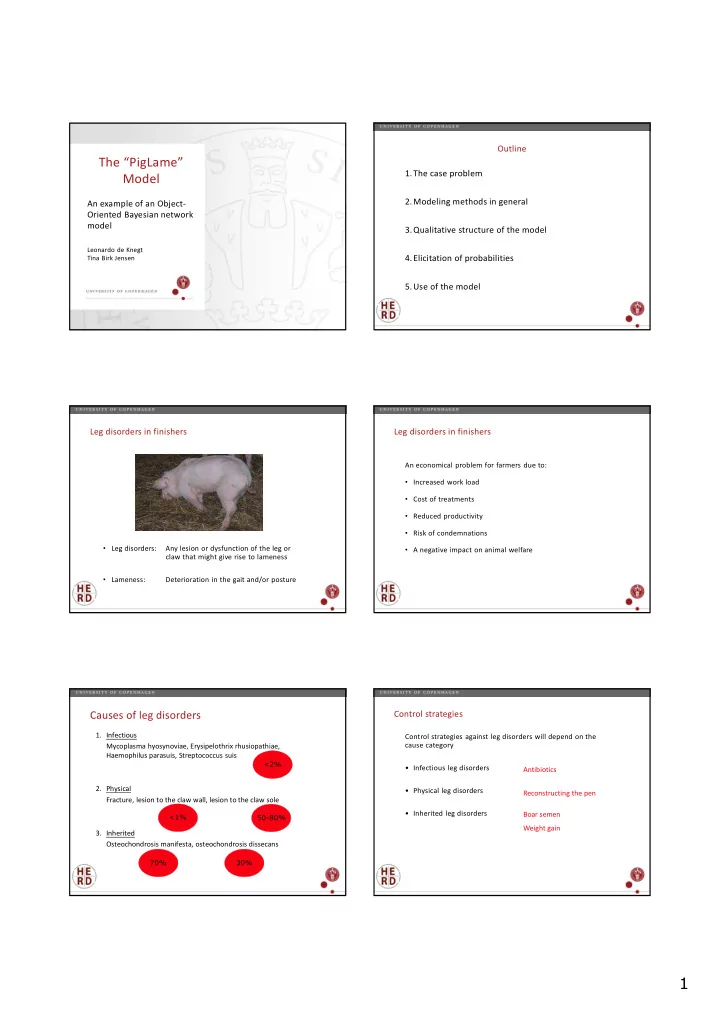
An example of an Object- Oriented Bayesian network model
Leonardo de Knegt Tina Birk Jensen
The “PigLame” Model
Outline 1.The case problem 2.Modeling methods in general 3.Qualitative structure of the model 4.Elicitation of probabilities 5.Use of the model Leg disorders in finishers
- Leg disorders:
Any lesion or dysfunction of the leg or claw that might give rise to lameness
- Lameness:
Deterioration in the gait and/or posture
Leg disorders in finishers
An economical problem for farmers due to:
- Increased work load
- Cost of treatments
- Reduced productivity
- Risk of condemnations
- A negative impact on animal welfare
Causes of leg disorders
- 1. Infectious
Mycoplasma hyosynoviae, Erysipelothrix rhusiopathiae, Haemophilus parasuis, Streptococcus suis
- 2. Physical
Fracture, lesion to the claw wall, lesion to the claw sole
- 3. Inherited
Osteochondrosis manifesta, osteochondrosis dissecans
<2% 50-80% <1% 30% 70%
Control strategies
Control strategies against leg disorders will depend on the cause category
- Infectious leg disorders
- Physical leg disorders
- Inherited leg disorders