
1
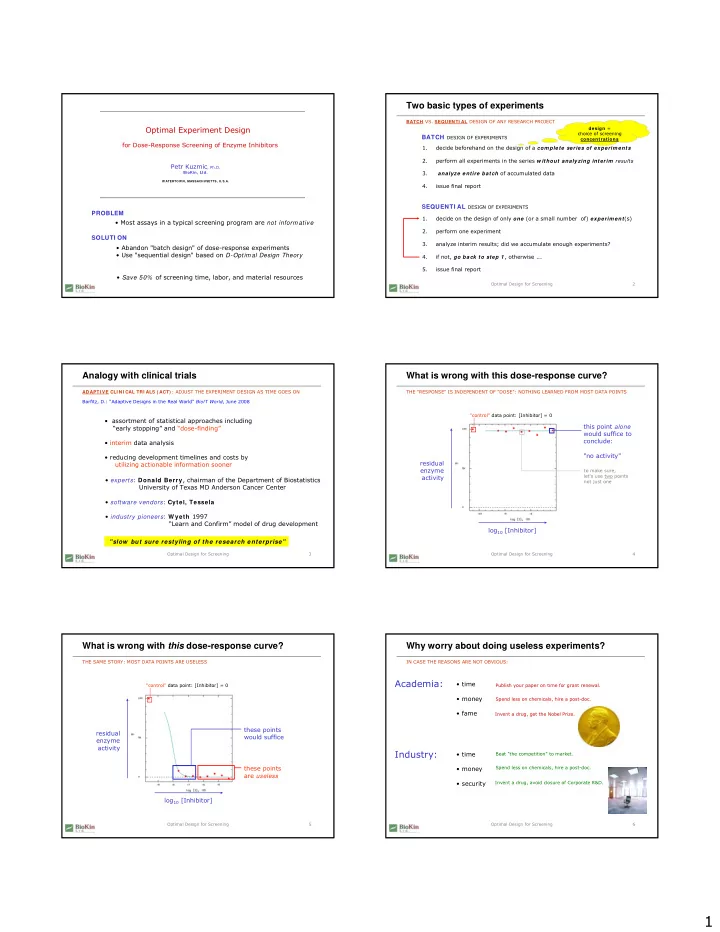
Optimal Experiment Design
for Dose-Response Screening of Enzyme Inhibitors Petr Kuzmic, Ph.D.
BioKin, Ltd.
W ATERTOW N, MASSACHUSETTS, U.S.A.
- Most assays in a typical screening program are not informative
- Abandon "batch design" of dose-response experiments
- Use "sequential design" based on D-Optimal Design Theory
- Save 50% of screening time, labor, and material resources
PROBLEM SOLUTI ON
Optimal Design for Screening 2
Two basic types of experiments
BATCH VS. SEQUENTI AL DESIGN OF ANY RESEARCH PROJECT
1. decide beforehand on the design of a com plete series of experim ents 2. perform all experiments in the series w ithout analyzing interim results 3. analyze entire batch of accumulated data 4. issue final report
BATCH DESIGN OF EXPERIMENTS
1. decide on the design of only one (or a small number of) experim ent(s) 2. perform one experiment 3. analyze interim results; did we accumulate enough experiments? 4. if not, go back to step 1 , otherwise ... 5. issue final report
SEQUENTI AL DESIGN OF EXPERIMENTS
design = choice of screening concentrations Optimal Design for Screening 3
Analogy with clinical trials
ADAPTI VE CLI NI CAL TRI ALS ( ACT) : ADJUST THE EXPERIMENT DESIGN AS TIME GOES ON Borfitz, D.: "Adaptive Designs in the Real World" BioIT World, June 2008
- assortment of statistical approaches including
“early stopping” and “dose-finding”
- interim data analysis
- reducing development timelines and costs by
utilizing actionable information sooner
- experts: Donald Berry, chairman of the Department of Biostatistics
University of Texas MD Anderson Cancer Center
- software vendors: Cytel, Tessela
- industry pioneers: W yeth 1997
“Learn and Confirm” model of drug development "slow but sure restyling of the research enterprise"
Optimal Design for Screening 4
What is wrong with this dose-response curve?
THE "RESPONSE" IS INDEPENDENT OF "DOSE": NOTHING LEARNED FROM MOST DATA POINTS
log10 [Inhibitor] residual enzyme activity
"control" data point: [Inhibitor] = 0
this point alone would suffice to conclude: "no activity"
to make sure, let's use two points not just one Optimal Design for Screening 5
What is wrong with this dose-response curve?
THE SAME STORY: MOST DATA POINTS ARE USELESS
log10 [Inhibitor] residual enzyme activity
"control" data point: [Inhibitor] = 0
these points would suffice these points are useless
Optimal Design for Screening 6
Why worry about doing useless experiments?
IN CASE THE REASONS ARE NOT OBVIOUS:
Academia:
- time
- money
- fame
Industry:
- time
- money
- security
Beat "the competition" to market. Spend less on chemicals, hire a post-doc. Invent a drug, avoid closure of Corporate R&D. Publish your paper on time for grant renewal. Spend less on chemicals, hire a post-doc. Invent a drug, get the Nobel Prize.