
1
T1, T2‐weighting
Water (Lean Tissue) vs. Fat Water (Lean Tissue) vs. Fat Signal Contrast Signal Contrast
1H Single Voxel MRS Chemical‐Shift‐Encoded Water‐Fat MRI Inversion Recovery (e.g. T1 nulling) Magnetization Transfer Diffusion
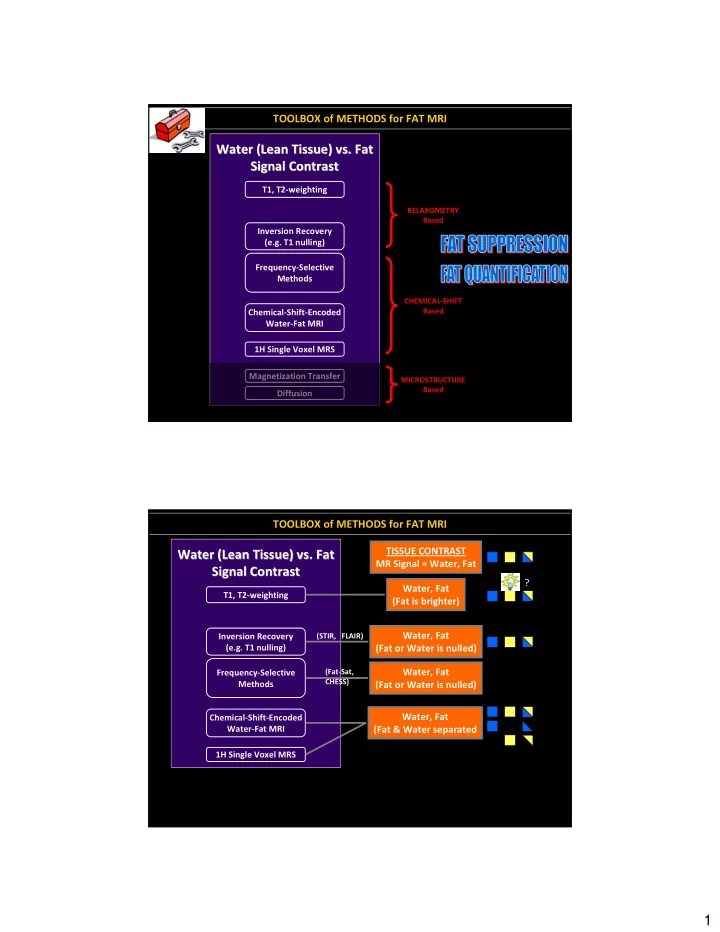
RELAXOMETRY Based CHEMICAL‐SHIFT Based MICROSTRUCTURE Based
Frequency‐Selective Methods
TOOLBOX of METHODS for FAT MRI
T1, T2‐weighting
Water (Lean Tissue) vs. Fat Water (Lean Tissue) vs. Fat Signal Contrast Signal Contrast
1H Single Voxel MRS Chemical‐Shift‐Encoded Water‐Fat MRI Inversion Recovery (e.g. T1 nulling) Frequency‐Selective Methods
TOOLBOX of METHODS for FAT MRI
TISSUE CONTRAST MR Signal = Water, Fat Water, Fat (Fat is brighter) Water, Fat (Fat & Water separated Water, Fat (Fat or Water is nulled)
(STIR, FLAIR)
Water, Fat (Fat or Water is nulled)
(Fat‐Sat, CHESS)
?