1 How Distribution of Classifier Values Stratified Trial Design: - - PDF document

1
SMART_READER_LITE
LIVE PREVIEW

1 How Distribution of Classifier Values Stratified Trial Design: - - PDF document

Trial Designs Assessing Application of Impact of Sensitivity and Biomarkers in Clinical Practice Specificity on Sample Size for Discovery Research Hypothesis: there is a Biomarker Trial Design validated biomarker classifier that accurately


slide-1
SLIDE 1

1

Impact of Sensitivity and Specificity on Sample Size for Biomarker Trial Design

Lucinda Billingham

Professor of Biostatistics Director, MRC Midland Hub for Trials Methodology Research Biostatistics Lead, Cancer Research UK Clinical Trials Unit University of Birmingham Joint Meeting of RSS Medical Section and MHTMR University of Birmingham, June 30th 2010

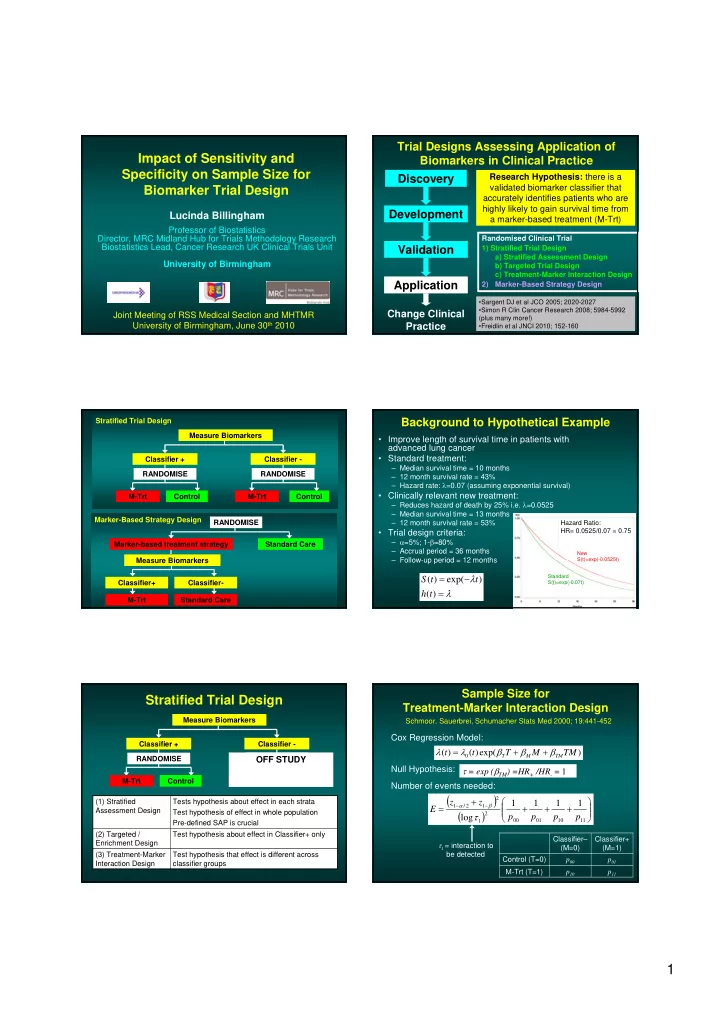
Trial Designs Assessing Application of Biomarkers in Clinical Practice Discovery Development Validation Application

Change Clinical Practice

Randomised Clinical Trial 1) Stratified Trial Design a) Stratified Assessment Design b) Targeted Trial Design c) Treatment-Marker Interaction Design 2) Marker-Based Strategy Design

  • Sargent DJ et al JCO 2005; 2020-2027
  • Simon R Clin Cancer Research 2008; 5984-5992

(plus many more!)

  • Freidlin et al JNCI 2010; 152-160

Research Hypothesis: there is a validated biomarker classifier that accurately identifies patients who are highly likely to gain survival time from a marker-based treatment (M-Trt)

Measure Biomarkers Classifier + Classifier - RANDOMISE M-Trt Control Control M-Trt RANDOMISE Stratified Trial Design Marker-Based Strategy Design RANDOMISE Marker-based treatment strategy Standard Care Classifier+ Classifier- Standard Care Measure Biomarkers M-Trt

Background to Hypothetical Example

  • Improve length of survival time in patients with

advanced lung cancer

  • Standard treatment:

– Median survival time = 10 months – 12 month survival rate = 43% – Hazard rate: =0.07 (assuming exponential survival)

  • Clinically relevant new treatment:

– Reduces hazard of death by 25% i.e. =0.0525 – Median survival time = 13 months – 12 month survival rate = 53%

  • Trial design criteria:

– =5%; 1-=80% – Accrual period = 36 months – Follow-up period = 12 months

     ) ( ) exp( ) ( t h t t S

New S(t)=exp(-0.0525t) Standard S(t)=exp(-0.07t)

Hazard Ratio: HR= 0.0525/0.07 = 0.75

Measure Biomarkers Classifier + Classifier - RANDOMISE M-Trt Control Control M-Trt RANDOMISE

OFF STUDY

Stratified Trial Design

Test hypothesis that effect is different across classifier groups (3) Treatment-Marker Interaction Design Test hypothesis about effect in Classifier+ only Tests hypothesis about effect in each strata Test hypothesis of effect in whole population Pre-defined SAP is crucial (2) Targeted / Enrichment Design (1) Stratified Assessment Design

Sample Size for Treatment-Marker Interaction Design

p11 p10 M-Trt (T=1) p01 p00 Control (T=0) Classifier+ (M=1) Classifier– (M=0)

 

 

            

  11 10 01 00 2 1 2 1 2 / 1

1 1 1 1 log p p p p z z E 

 

1 = interaction to be detected Schmoor, Sauerbrei, Schumacher Stats Med 2000; 19:441-452

) exp( ) ( ) ( TM M T t t

TM M T

        Cox Regression Model: Number of events needed: Null Hypothesis:  = exp (TM) =HR+ /HR- = 1

slide-2
SLIDE 2

2

Measure Biomarkers Classifier + Classifier - RANDOMISE M-Trt Control Control M-Trt RANDOMISE

Stratified Trial Design: Naïve Approach to Sample Size

=0.07 =0.07 =0.07 =0.0525 HR- = 1 HR+ = 0.75

50% 50% 1= HR+ / HR- = 0.75 With Sig=5% and Power=80% need D=1516 , N=1900

How Distribution of Classifier Values Affect Classifier Performance

Soreide K J Clin Pathol 2008

Effect of Sensitivity and Specificity of Classifier on Stratified Trial Design

Measure Biomarkers N=1900 950 Classifier+ 950 Classifier - RANDOMISE RANDOMISE M-Trt Control M-Trt Control 760 True+ 190 True- 190 True+ 760 True-

c+d d c Measured Classifier- b+d b True Classifier- N a+c Total a+b a Measured Classifier+ Total True Classifier+

Sensitivity=a/a+c Specificity=d/b+d

How does Sensitivity and Specificity of Classifier Affect Statistical Power?

  • Assess impact of different levels of

sensitivity and specificity on estimate of  and power using simulation

  • Implemented in SAS, 1000 simulations

Reference: Hoering, LeBlanc, Crowley; Clinical Cancer Research 2008;14:4358-4367

Simulation: Generate Survival Times for Each Population From Exponential

Measure Biomarkers N=1900 R

M-Trt Control M-Trt

M+T+ M+T- M-T+ M-T-

Control Control Control M-Trt M-Trt

R R R

=0.0525 =0.0525 =0.07 =0.07 =0.07 =0.07 =0.07 =0.07

Recruitment times generated from Uniform(0,36) Follow-up time = 12 months after end of recruitment Survival times censored at the end of the follow-up period

NB: not prognostic

Simulation: Samples Generated from 8 Populations

N (1-p)N pN Total [(1-se)p+sp(1-p)]N sp(1-p)N (1-se)pN Measured Classifier- [sep+(1-sp)(1-p)]N (1-sp)(1-p)N sepN Measured Classifier+ Total True Classifier- True Classifier+ Sensitivity = p(correctly classifying a true classifier+) = se Specificity = p(correctly classifying a true classifier-) = sp True prevalence of classifier+ = p = 50% Randomisation ratio = k = 50%

Multiply each of the above 4 cells by k and 1-k to obtain 8 populations

slide-3
SLIDE 3

3

Simulation: Results for Stratified Trial Design

0.83 44% 0.85 38% 0.80 63% 0.78 71% 0.75 81%

E()

Power Testing interaction N=1900 65% 80% 90% 95% 100% Specificity 95% 80% 90% 95% 100% Sensitivity

Prevalence of true classifier+ = 50% Control treatment: -=+= 0.07 (i.e. not prognostic) M-Trt treatment: - = 0.07 + = 0.0525   = 0.75

Marker-Based Strategy Design: Naïve Approach to Sample Size

RANDOMISE Marker-Based Treatment Strategy Standard Care Classifier+ 50% Classifier- 50%

= 0.0525 = 0.07 = 0.07

Classifier+ 50% Classifier- 50%

M-Trt Standard Standard Standard = 0.07

Hazard = 0.06125 Hazard = 0.07 HRMSvsSC = 0.875 With Sig=5% and Power=80% need D=1762 , N=2148 Measure Biomarkers

Marker-Based Strategy Design: Effect of Sensitivity and Specificity

RANDOMISE (N) Marker-based treatment strategy Standard Care Classifier+ Classifier- Standard Care Measure Biomarkers M-Trt True+ True- True+ True-

Simulation: Results for Marker-Based Strategy Design

0.91 48% 0.89 71% 0.88 78% 0.87 83% 0.86 88% E(HR) Power Testing Strategy Effect N=2148 60% 80% 90% 95% 100% Specificity 60% 80% 90% 95% 100% Sensitivity

Prevalence of true classifier+ = 50% Control treatment: -=+= 0.07 (i.e. not prognostic) Experimental treatment: - = 0.07 + = 0.0525  HRMSvsSC = 0.875

Further Work

  • Refine the simulation to sample from a

distribution of biomarker values

  • Assess the impact of other factors on statistical

power

– different underlying hazard rates – biomarker classifiers being prognostic as well as predictive – prevalence of true classifier+ being different from 50%

  • Publish!

Summary

  • Biomarker classifiers that have been developed

and validated need to be tested in a randomised setting before use in clinical practice

  • Practicalities of biomarker measurement is a

crucial aspect of the trial design

  • Different trial designs should be considered to

determine which is most appropriate and efficient for the given situation

  • Statistical power is affected by

– Sensitivity and specificity of the classifier – Prevalence of classifier+ patients – Prognostic impact of the classifier – Level of treatment effect in classifier- patients – Randomisation allocation ratio