1 A1: policy context A2 Observational Evidence and Capabilities - - PDF document

1
SMART_READER_LITE
LIVE PREVIEW

1 A1: policy context A2 Observational Evidence and Capabilities - - PDF document

Overview TF HTAP draft final report PART A: Chapter structure Ozone-Aerosol Dentener, HTAP, Brussels June, 2010 1 Dentener, HTAP, Brussels June, 2010 2 Chapter A1: Conceptual Overview of Hemispheric or Intercontinental Transport -


slide-1
SLIDE 1

1

Dentener, HTAP, Brussels June, 2010 1
  • Per chapter
  • Status
  • Research needs
  • What are the main messages that need to be brought out?
  • What do we know and why should we care?
  • What work needs to be completed to convey these main

messages? Overview TF HTAP draft final report PART A: Ozone-Aerosol

Dentener, HTAP, Brussels June, 2010 2
  • Chapter A1: Conceptual Overview of Hemispheric or Intercontinental Transport
  • f Ozone and Particulate Matter
  • Chapter A2: Observational Evidence
  • Chapter A3: Emissions & Projections
  • Chapter A4: Global and Regional Modeling
  • Chapter A5: Impacts on Health, Ecosystems, and Climate
  • Chapter A6: Synthesis

Chapter structure

Dentener, HTAP, Brussels June, 2010 3

A1: Conceptual Overview of Hemispheric or Intercontinental Transport of Ozone and Particulate Matter. Dick Derwent/Owen Cooper

  • Introducing policy context; source, transport patterns, emissions, lifetimes

Baseline concentrations refer to observations made at a site when it is not influenced by recent, locally emitted or produced man-made pollution. Global or hemispheric background concentration is a model construct that estimates the atmospheric concentration of a pollutant due to natural sources only.

  • Source Receptor versus Source Attribution
  • What are the driving mechanisms of long-range transport/meteorology, and how influence

by climate change.

  • Introduction of Chapter 2-6 (small update if needed)
  • 27 pages
Dentener, HTAP, Brussels June, 2010 4

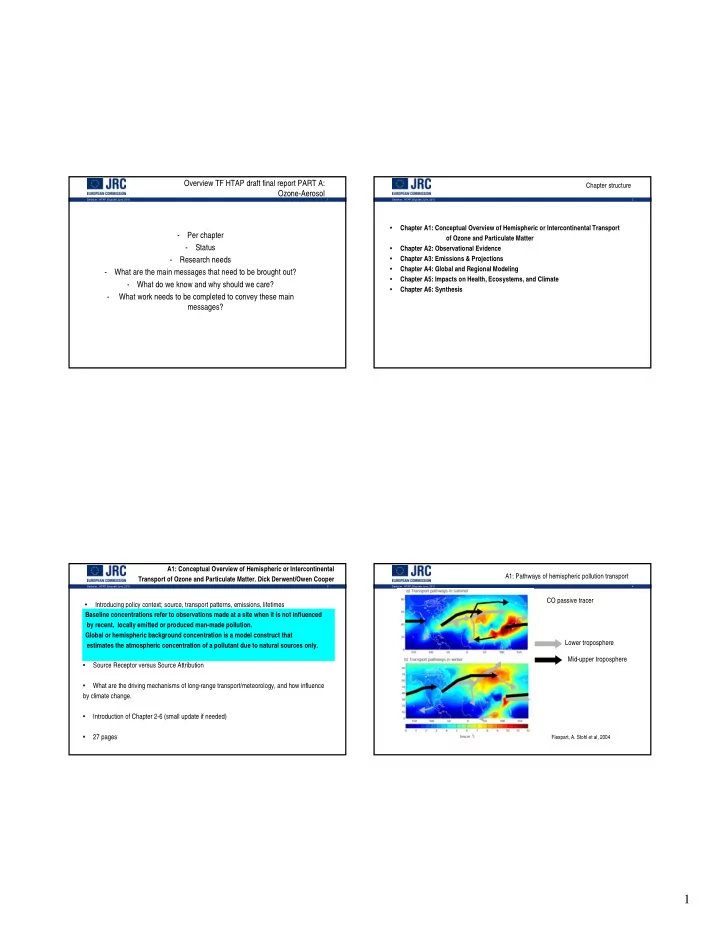
Lower troposphere Mid-upper troposphere

Flexpart, A. Stohl et al, 2004

CO passive tracer A1: Pathways of hemispheric pollution transport

slide-2
SLIDE 2

2

Dentener, HTAP, Brussels June, 2010 5

A1: policy context

Dentener, HTAP, Brussels June, 2010 6

A2 Observational Evidence and Capabilities Related to Intercontinental Transport of Ozone and Aerosols. Kathy Law, David Parrish

  • Direct observational evidence for long-range transport of ozone and aerosols

from satellite, aircraft, and ground-based data.

  • Long-term changes (trends) in the amount of ozone or aerosols
  • Using meteorological/tracer measurements for source attribution
  • Field experiments
  • Recommendations
Dentener, HTAP, Brussels June, 2010 7

A2.2 ozone Present satellite retrievals are limited to tropospheric columns with little vertical profile information. Satellites are particularly valuable for tracking emission changes of NO2 over source regions. Also other components (CO, SO2, CH2O)

Dentener, HTAP, Brussels June, 2010 8

PICO-NARE Observatory (Azores, Portugal) transport of boreal wildfire emissions.

CO is plotted with open blue circles, NOy is plotted with red squares, BC is plotted with open purple triangles and O3 is plotted with green triangles.

Several other examples: Do they convey the message of event and broad contineous transport and their relevance? A2: example of event NAS Report

slide-3
SLIDE 3

3

Dentener, HTAP, Brussels June, 2010 9

Models A2: Ozone trends Pre-industrial levels not well understood What about recent trends?

Dentener, HTAP, Brussels June, 2010 10

A2: Airquality implications Mace Head LRT Air quality issues in outflow of Asia and in Arctic

Dentener, HTAP, Brussels June, 2010 11

A2 transport of Aerosol;satellite based Increasing role of lidar, satellite, and satellite lidar Ground-based lidar networks and mountain top measurement sites in Europe, North America and Asia provide large continuous data sets to characterize events

Dentener, HTAP, Brussels June, 2010 12 Bermuda BCO: Annual (Daily) Means 1989 - 1998 0.0 0.5 1.0 1.5 2.0 2.5 1989 1990 1991 1992 1993 1994 1995 1996 1997 1998 Nitrate Aerosol (ug/m3) 5 10 15 20 25 30 35 40 45 50 US Emissions NOx (Steets) NO3 Streets US NOx Bermuda BCO: Annual (Daily) Means 1989 - 1998 0.0 0.5 1.0 1.5 2.0 2.5 3.0 3.5 4.0 1989 1990 1991 1992 1993 1994 1995 1996 1997 1998 nss-Sulfate Aerosol (ug/m3) 5 10 15 20 25 30 35 US Emissions SOx (Streets) nss-SO4 Streets US SOx

Decades in-situ measurements have established the importance of intercontinental transport

  • f aerosol from dust, forest fires, and anthropogenic sources.

Need for expansion of observational networks Optimum observation strategy for in situ and ground-based measurements to characterize intercontinental transport of aerosols. A particular focus should be on additional measurements to quantify the sources and properties of the organic and black carbon components of transported aerosols A2: long term surface observations

slide-4
SLIDE 4

4

Dentener, HTAP, Brussels June, 2010 13

A2: Models-Measurement: Flexpart, adjoint, inverse Particle dispersion models for source attribution; adjoint, complementary to Eulerian models Picture also in Chapter 4

Dentener, HTAP, Brussels June, 2010 14
  • Utilize proxy records of aerosol deposition (e.g. from ice cores) as targets

to test simulations of chemical transport models over multi-decade intervals. Analysis of long-term aerosol and trace element records provides information about inter-annual variability in source attribution as a particular downwind measurement site as well as insights into how emissions may have changed in the past. A2: Use of tracer (ratios) to demonstrate LRT

Dentener, HTAP, Brussels June, 2010 15

A2 Tracer ratios, O3-CO-VOC, fingerprinting

  • Measured trace elements and isotopic ratios can provide useful constraints on different source types

and emission regions influencing aerosol data.

  • Further development of isotope and geochemical fingerprinting techniques for the identification of different

source types and, in the case of stable isotopes information about chemical processes occurring during transport.`

Dentener, HTAP, Brussels June, 2010 16

A2: Lagrangian experiments

  • Provide information on plume processing during transport
  • Evaluates performance of global models, and the impact of resolution,

regarding plume transport and speed of dilution

  • Can be used to develop plume-in-grid descriptions for global models
  • Better understanding of mass entrainment FT to BL.
slide-5
SLIDE 5

5

Dentener, HTAP, Brussels June, 2010 17

A2: Research needs

  • Surface sites; mountains sites; role of WMO-GAW
  • Vertical profiles
  • Aircraft- commercial airlines and unmanned aircraft
  • Satellite: current use, w/ surface observations models; geostationary, future missions

(gap)

  • Using existing datasets for testing of models: beyond climatological testing/events
Dentener, HTAP, Brussels June, 2010 18

Rather long 67 pages=>shorten. Some duplications (e.g. modelling section,w/chapter 3,4). Some sections need more focus on message Many key messages- would be good to reduce/combine/organize them to make them stronger … but overall a lot of good material is there! A2: Remaining Issues

Dentener, HTAP, Brussels June, 2010 19

A3: Emissions and Projections, J. van Aardenne, D. Streets

  • Available datasets for studies of hemispheric transport of AP: current and future (RCPs)
  • Description of data in EDGAR-HTAP (hierarchy of datasets)
  • Emission trends 1850-2100
  • Natural emissions
  • Case study for Asia
  • Examples of trends in the USA
  • Integration of emissions, modelling, measurements
  • Constraints from satellites
Dentener, HTAP, Brussels June, 2010 20 20 40 60 80 100 120 140 1850 1860 1870 1880 1890 1900 1910 1920 1930 1940 1950 1960 1970 1980 1990 2000 Tg SO2
  • Int. shipping
  • Int. aviation
REF OECD90 MAF LAM ASIA
  • 1a. Harmonized RCP inventory
20 40 60 80 100 120 140 2000 2001 2002 2003 2004 2005 Tg SO2
  • Int. shipping
  • Int. aviation
REF OECD90 MAF LAM ASIA
  • 1b. JRC-HTAP inventory
20 40 60 80 100 120 140 2000 2005 2010 2020 2030 2040 2050 2060 2070 2080 2090 2100 Tg SO2
  • Int. shipping
  • Int. aviation
REF OECD90 MAF LAM ASIA
  • 1c. RCP-3PD scenario
20 40 60 80 100 120 140 2000 2005 2010 2020 2030 2040 2050 2060 2070 2080 2090 2100 Tg SO2
  • Int. shipping
  • Int. aviation
REF OECD90 MAF LAM ASIA
  • 1d. RCP-4.5 scenario
20 40 60 80 100 120 140 2000 2005 2010 2020 2030 2040 2050 2060 2070 2080 2090 2100 Tg SO2
  • Int. shipping
  • Int. aviation
REF OECD90 MAF LAM ASIA
  • 1e. RCP-6.0 scenario
20 40 60 80 100 120 140 2000 2005 2010 2020 2030 2040 2050 2060 2070 2080 2090 2100 Tg SO2
  • Int. shipping
  • Int. aviation
REF OECD90 MAF LAM ASIA
  • 1e. RCP-8.5 scenario

Long-term emission trend datasets (century-scale) are becoming available and present a new

  • pportunity to characterize

intercontinental pollution flows in the past and future. Uncertainties are higher the further away we get from present-day conditions Gridded emission distributions for the past and future are rudimentary.

A3: Current+future datasets

slide-6
SLIDE 6

6

Dentener, HTAP, Brussels June, 2010 21
  • A long-term dataset of major anthropogenic emissions from 1850-2100 at 0.1º × 0.1º

available for use in chemical transport models to assess changes in intercontinental transport over time. Future emissions use the IPCC AR5 Representative Concentration Pathway (RCP) scenarios

  • Comparison of the EDGAR-HTAP dataset (regional emission inventories substitute

global data) (2000-2005)

  • Present-day emissions are relatively well understood by sector and world region but

some species are still unreliable in some parts of the world (e.g., black carbon and NMVOC emissions from developing countries, NH3)

  • New spatially distributed proxy datasets are needed to more accurately distribute past

and future emissions

  • This adds uncertainty to our ability to reliably model intercontinental transport; some

source/receptor relationships are inherently better known than others A3: key messages

Dentener, HTAP, Brussels June, 2010 22 2 4 6 8 10 12 14 16 18 1970 1975 1980 1985 1990 1995 2000 2005 REF OECD90 MAF LAM ASIA

A3: Natural emissions; biomass burning natural sources soil emissions, windblown dust, volcanoes, and remote biomass burning rarely fall within the purview of national governments and may need greater attention from the TF HTAP. Natural emissions are changing in time: new approaches needed to quantify them

Dentener, HTAP, Brussels June, 2010 23 20 40 60 80 100 120 1980 1985 1990 1995 2000 2005 2010 2015 2020 2025 2030 SO2 (Mt) Year REAS REAS(PSC) REAS(REF) REAS(PFC) Zhang et al. GAINS(Baseline) GAINS(Lower) RCP 6.0 RCP 4.5 RCP3- PD (2.6) RCP 8.5 SRES(A1AIM) SRES(A2ASF) SRES(B1IMAGE) SRES(B2MESSAGE)

A3: Case study Asia

Emissions are not always the same among inventories compiled by different research groups, and sometimes the differences are large.

  • harmonisation good, but finding underlying reasons better
  • lessons to be learned from country/regional inventories (e.g. RAPIDC)

SO2

Dentener, HTAP, Brussels June, 2010 24
  • The integrated study of emissions, forward and inverse modeling, and satellite and ground
  • bservations can usefully bound source magnitudes and lead to improved emission inventories.
  • Previous studies demonstrate a clear need for the development of an integrated framework of

emissions, models, and observations that can be readily applied to different intercontinental transport situationsand can quickly adapt to new technical capabilities as they arise (new satellite retrievals, new network data releases, etc.)

  • Careful study of the large-scale relationships between primary precursor emissions (e.g., emission

ratios, speciation profiles) and observed secondary species (from satellites, campaigns, networks) can advance our understanding of the formation mechanisms and our ability to select effective mitigation options for the primary species.

A3: Inverse modelling of emissions

slide-7
SLIDE 7

7

Dentener, HTAP, Brussels June, 2010 25
  • 55 pages- lots of figures, it can be shortened. Overall structure seems to work.
  • Some duplications (e.g. modelling section,w/chapter 2; satellite stuff).
  • Some sections need to be completed, material to be integrated
  • Good section on integration
  • Missing explicit description of emissions used in Chapter 5, mitigation costs

A3: Issues

Dentener, HTAP, Brussels June, 2010 26

A4: Global and Regional Modeling G. Carmichael, O. Wild

  • Description of modelling approaches; intercomparison, model source attribution
  • Quantification of intercontinental transport
  • O3 trends
  • HTAP modelling study; CH4, yearly month, MDA8 (policy relevant) O3
  • LRT influence of O3 on various time and spatial scales, scalability of O3 SR (linearity)
  • Aerosol: SR surface concentrations, deposition, column load, linearity of aerosol SR

policy relevant SR

  • AEROCOM-HTAP specific experiments on dust and biomass burning, hindcast
  • Source attribution
  • Uncertainty: parameterizations, resolution, chemistry
  • Changes due to future emissions and climate change
Dentener, HTAP, Brussels June, 2010 27

The observed regional and seasonal variability in surface ozone is reproduced relatively well in current models lending confidence in our ability to represent the key large-scale processes controlling the formation, transport and removal

  • f ozone and its precursors. However, significant

discrepancies exist on shorter spatial and temporal scales indicating weaknesses in our representation of local- and urban-scale processes in current models. A4: current model skills for O3

Dentener, HTAP, Brussels June, 2010 28

Regional model studies suggest that sub-grid-scale processes (convection, frontal lifting, heterogeneous PBL mixing, etc.) have a major effect on pollution export. Differences in chemical mechanism lead to large differences in regional model results. Support the application of high-resolution global and regional models to investigate the effect of smaller-scale processes on continental import and export budgets. Current global CTMs are unable to resolve the strong chemical contrasts associated with urban regions, and so are not generally appropriate for evaluating the impact of long-range transport on attainment of air quality standards in these environments

Apply newly-available modelling tools (e.g., multiple-nested models from global to urban scales, assimilation and bias-correction approaches) along with remote-sensing data to improve assessment and representation of intercontinental transport processes. A4: Scale Issues

slide-8
SLIDE 8

8

Dentener, HTAP, Brussels June, 2010 29

Given that models may be underestimating the anthropogenic contribution to surface ozone, we have high confidence that current surface ozone is significantly higher than preindustrial levels (NAS, 2009). The observed increase in surface ozone over the past 40 years is reproduced qualitatively by current models, but there are significant differences in the magnitude and regional variation in this trend compared with observations. These discrepancies indicate that precursor emissions and/or atmospheric processes are not represented well in current models. Need to examine observed trends in surface ozone through multi-year model simulations using most reliable assessments of changing emissions and meteorology in order to (1) explain/attribute changes, (2) put observed trends in a global context, and (3) critically test model ability to reproduce long-term composition changes. A4: understanding O3 trends

Dentener, HTAP, Brussels June, 2010 30

Estimates of S-R relationships indicate that 20% changes in present-day anthropogenic precursor emissions affect regional monthly mean surface ozone by 0.2-0.9 ppbv (over continental regions downwind. This is about 10-20% of the impact over the emission region itself on an annual basis. However, this masks large temporal and geographic variability which needs to be characterised much better.

A4: O3 Source Receptor relationships

NA EU EA SA

Controlling CH4 is/will be of major importance in limiting increases in baseline surface ozone

Dentener, HTAP, Brussels June, 2010 31 Figure A4.6.2.1: Difference in annual-average surface ozone concentrations between the 2090s and 2000s decade for a) GISS-PUCCINI-ModelE, b) STOC-HadAM3 and c) UM-CAM. The differences are due to climate and climate-sensitive natural emissions changes alone (lightning for both models; isoprene for STOC-HadAM3). Units are ppb. The 500ppt contour of NOx concentrations for the 2000s decades is shown in black.

Future changes in climate are expected to increase the effect of precursor emissions

  • ver the source region and reduce the

effect over downwind receptor regions. However, the magnitude of these effects is relatively small, and is driven by changes in the lifetime of NOy and not by changes in transport patterns. The effect of natural emission changes and wider climate- related feedbacks have not been evaluated fully yet A4: O3 and climate change

Dentener, HTAP, Brussels June, 2010 32

A2: linearity/scalability of SRs; scenarios

slide-9
SLIDE 9

9

Dentener, HTAP, Brussels June, 2010 33

Export fractions for NOy from each HTAP source region feach season A4: Ndep In many regions deposition of oxidised sulphur and nitrogen is large, and exceedance of critical loads occurs widely over many ecosystems. The intercontinental contribution to these exceedances is small. However, particular attention should be paid to long range transport to polar regions where ecosystems are likely to be more vulnerable.

Dentener, HTAP, Brussels June, 2010 34

Multi-model experiments shown that over the 4 polluted regions, the surface concentrations of sulfate and BC are mostly (70-90%) from “domestic” pollution sources. However, “foreign” contributions are increasingly large at higher altitudes. Over the Arctic surface, European pollution is the most significant source of sulfate while biomass burning from Eurasia is the major contributor to BC and POM. More than 80% of surface dust is from Asia and Africa A4: LR transport to the Arctic

Dentener, HTAP, Brussels June, 2010 35

A4: Aerosol modelling HTAP/AEROCOM

Dentener, HTAP, Brussels June, 2010 36

A4: Source attribution of Aerosol

Near linearity Over the 4 polluted regions, the surface concentrations of sulfate and BC are mostly (70-90%) from “domestic” pollution sources. “foreign” contributions are increasingly large at higher altitudes. Over the Arctic surface, European pollution is the most significant source of sulfate while biomass burning from Eurasia is the major contributor to BC and POM. More than 80% of surface dust is from Asia and Africa

SO4 BC POM Dust

slide-10
SLIDE 10

10

Dentener, HTAP, Brussels June, 2010 37

Rather long 70 pages=>needs to be shortened Organisation can be improved Lack material on TP1x and Field experiments Provide key messages needed for Synthesis A4 needs most work! A4: Remaining Issues

Dentener, HTAP, Brussels June, 2010 38

A5: Impacts on Human health, Ecosystem, and climate

  • Introduction: AQ standard
  • Human health: effects of PM; O3; short term and long term LRT effects
  • Ecosystems-Agriculture: experimental evidence, metrics, interaction with LRT, climate change
  • Climate: ozone+PM Radiative Forcing; mechanisms of RF

short-lived/long-lived components regional forcings; regional+global response; Arctic; relationship of emissions-RF; future RF.

Dentener, HTAP, Brussels June, 2010 39
  • 235 µg/m3

Indonesia

  • 118 µg/m3 (60 ppbv)

Japan 118 µg/m3 (60 ppbv) 196 µg/m3 (100 ppbv) South Korea

  • 200 µg/m3

China (Grade II) 100 µg/m3 180 µg/m3 India 147 µg/m3 (75 ppbv)

  • USA

120 µg/m3 (60 ppbv)

  • EU

100 µg/m3 (51 ppbv)

  • WHO

8 hr 1 hr Country Ozone Standards, µg/m3

A5: Worldwide ozone standards: short-term

Dentener, HTAP, Brussels June, 2010 40

A5: Impacts/Health

  • There is broad consensus that exposure to ambient PM and ozone causes

adverse health effects that range from minor sensory irritation to death.

  • Short-term exposure to PM is associated with increased daily mortality and morbidity in hundreds
  • f studies worldwide. Long term exposure to PM2.5 has been associated with increased mortality

from chronic cardiovascular and respiratory disease.

  • PM is the most important air pollutant for health.
  • Short-term exposure to ozone is associated with increased daily mortality and morbidity in

hundreds of studies worldwide. Unlike PM, the evidence linking ozone with long-term mortality is limited.

slide-11
SLIDE 11

11

Dentener, HTAP, Brussels June, 2010 41

3 studies have estimated that reductions in ozone precursor emissions may avoid more premature mortalities outside of some source regions than within, mainly because of larger populations outside of those source regions; especially North America and Europe A5: premature deaths

Dentener, HTAP, Brussels June, 2010 42
  • Contributions to PM from emissions within a region are expected to be much more important for

human health than emissions from foreign continents.

  • Influence potential, impact per unit of emissions, 1-3 orders of magnitude smaller for LRT.
  • Intercontinental transport of PM is estimated to cause more human mortalities than

intercontinental transport of ozone, due to the stronger relationships between PM and mortality.

  • In one study, most of the mortalities due to intercontinental PM are attributed to dust; those

attributed to anthropogenic PM are estimated to be ~25% of the total. A5: Impacts-Health; findings

Dentener, HTAP, Brussels June, 2010 43

Estimates of health impacts of air pollutants and long-range transport need research on:

  • concentration-response relationships in less industrialized nations - over a range of

concentrations, including short-term and long-term effects - low- or high-concentration thresholds,

  • improving the resolution of global atmospheric models and improving nested models that

encompass the global, regional, and urban scales, to better represent concentration gradients in and near urban areas,

  • the possible differential toxicity of different PM components and particle sizes,
  • possible changes in PM and pollutant mixtures as they are transported and age, and the

effects of such changes on toxicity,

  • possible interactive effects of PM, ozone, and other pollutants on human health.

A5: Health Recommendations

Dentener, HTAP, Brussels June, 2010 44

A5: Impacts on vegetation

  • Ozone impacts on agricultural crops- forests-grasslands: key-experiments only from

Europe, North America and lesser extent Asia.

  • PM radiation impacts, and deposition (eutrophication/acidification)
  • Different metrics in Europe (AOT40) and North America (SUM06, Mx)
  • AOT30 was as statistically robust in terms of defining crop damage but was considered

have implications for control strategies outside of Europe and hence AOT40 was retained

  • Flux metric better suited to deal with rising background O3
slide-12
SLIDE 12

12

Dentener, HTAP, Brussels June, 2010 45

Currently, global yield losses are predicted to range between 3%-5% for maize, 7% -12% for wheat, 6% -16% for soybean, 3% - 4% for rice, which represents an economic loss of $14-$26 billion (10^9) per year A5: Vegetation; yield losses

Dentener, HTAP, Brussels June, 2010 46
  • Experimental studies using O3 profiles that simulate enhanced background O3 concentrations, perhaps

with a focus on crops, forests and grasslands that have growth periods extending into those seasonal periods when the relative LRT contribution to pollution is greatest.

  • A pan-Asian OTC/FACE field campaign to establish dose-response relationships specific for Asian

species (crops, forests and grasslands) growing under Asian climatic and management conditions.

  • Assessment of the suitability of the flux based O3 index to identify LRT effects on ecosystems.
  • Development of flux networks that monitor O3 fluxes in addition to other biogeochemical species (such

as N, C and water vapour).

  • An improved understanding of the processes by which seasonality in O3 exposure influence damage to

ecosystems.

  • Global modelling experiments that use flux-based indices to estimate the influence of LRT on ecosystem

damage.

  • Improved critical loads for tropical and Asian ecosystems.
  • Improved understanding of how LRT may influence recovery or time-development of damage of

ecosystems to acidification and eutrophication.

A5: vegetation recommendations

Dentener, HTAP, Brussels June, 2010 47

A5: Impacts - Climate Mainly looks at RF; lot of introductory material

RF due to aerosols and ozone are highly uncertain, among the most important uncertainties in climate

  • change. Observations of aerosol absorption and

vertical distributions are particularly needed to reduce these uncertainties. Forcings resulting from changes in emissions of aerosols, their precursors, and ozone precursors (except methane) depend strongly on location, timing, and the background composition, and these dependencies merit further research. Reductions in PM would improve air quality, but for cooling aerosols, including sulfate, nitrate and

  • rganic carbon, this would generally exacerbate

global warming. Reductions in BC would typically are likely to benefit both air quality and climate.

Dentener, HTAP, Brussels June, 2010 48 33%±20% 20%±13% 12%±11% 16%±15% BC+POM+Sulfa te 37%±20% 19%±12% 12%±10% 17%±15% Sulfate 10%± 7% 20%± 7% 17%±18% 23%±24% POM 20%± 8% 13%± 6% 22%±20% 38%±38% BC SA EA EU NA Receptor Import sensitivity (mean ± std. dev) for annual-averaged top-of-atmosphere all-sky aerosol direct radiative forcing

A5: Import sensitivity of RF

slide-13
SLIDE 13

13

Dentener, HTAP, Brussels June, 2010 49

A5: Climate Change in the Arctic

The Arctic is experiencing rapid climate change. Arctic climate is affected by ozone and aerosols that are the result of long-range transport from other regions, as well as by ozone and aerosols

  • utside of the Arctic. Deposition of black carbon in snow is

understood to be an important contributor to warming in the Arctic.

Dentener, HTAP, Brussels June, 2010 50

A5: emissions based RF Big difference for CH4

Dentener, HTAP, Brussels June, 2010 51

Rather long 79 pages=>needs to be shortened overall Health-section; parts needs to be finished Vegetation- some overlap with A4; and with A5-climate; need key finding Health-Climate: key findings are very general A lot of good material! A5: Impacts;Remaining Issues

Dentener, HTAP, Brussels June, 2010 52

Overview of Chapter A6: Summary

  • Observational Evidence: Events and Trends
  • Use of Modeling Analyses
  • Source Attribution
  • Source/Receptor Relationships
  • Impacts on AQ Standards, Health, Ecosystem, Climate
  • Effect of Expected Changes in Emissions and Climate
  • Implications for International Policy
  • Further Research and Analysis Needs
slide-14
SLIDE 14

14

Dentener, HTAP, Brussels June, 2010 53

A6:O3 Source Attribution

(illustrative only, not quantitative)

200 400 600 800 1000 1200 1400 1600 1800 2000 CH4 Concentration 5 10 15 20 25 30 35 40 45 50 Ozone Concentration 20 40 60 80 100 120 140 NOx Emissions 200 400 600 800 1000 1200 VOC and CO Emissions 200 400 600 800 1000 1200 1400 1600 1800 2000 5 10 15 20 25 30 35 40 45 50 20 40 60 80 100 120 140 200 400 600 800 1000 1200

NOX VOC & CO CH4 O3 Pre Industrial Present Day Anthropogenic Natural NOx/VOC/CO in Region NOx/VOC/CO

  • ut of Region

Methane Natural

What should we compare?

  • past, present, future
  • global, region
  • average, peak
Dentener, HTAP, Brussels June, 2010 54

20 40 60 80 100 120 140

EA SA EU NA AR PM Surface Concentration (ug/m3) A6: PM Source Attribution

(Illustrative, Based on Table 4.8)

Anthro PM & precursors in Region Anthro PM & precursors

  • ut of Region

Vegetation Burning? Dust & Sea Salt

What should we compare?

Dentener, HTAP, Brussels June, 2010 55

A6: Ozone Impacts

  • Air Quality Objectives and Standards

– In-source region emissions contribute the most to the highest peak concentrations, and therefore, exceedances of standards based on short term average concentrations. – Intercontinental transport is already sufficient to exceed the thresholds of some air quality objectives, particularly those based on long-term averages or accumulated exposure over a threshold concentration (AOT40, …)

  • Source-Receptor Sensitivity

– Ozone concentrations are most sensitive to changes in in-source region emissions, but changes in intercontinental transport can produce 30-70% of the response (impact sensitivity) of the in-source region controls.

  • Health Impacts

– Intercontinental transport of ozone may contribute 20% to >50% of avoided mortalities in a given receptor

  • region. Emissions reductions, particularly in EU and NA, may produce more health benefits outside the

source region than within.

  • Ecosystem Impacts

– Intercontinental transport of ozone may contribute up to 40% of crop yield loss, depending on location, crop and response functions used. At current baseline levels, crop yield loss exceeds $15B globally; any further increase will exacerbate this exposure.

  • Climate Impacts

– Ozone and its precursors, particularly methane contribute significantly to changes in global and regional climate, depending on location, timing, and background composition.

Dentener, HTAP, Brussels June, 2010 56

A6: PM Impacts

  • Air Quality Objectives and Standards

– Intercontinental transport events (particularly associated with dust and fires) are sufficient to exceed the thresholds of standards based on short-term average concentrations. – Except for dust (and vegetation burning?), intercontinental transport of PM is generally small, but may contribute a large fraction of concentrations in clean areas.

  • Source-Receptor Sensitivity

– PM concentrations are most sensitive to changes in in-source region emissions, but changes in intercontinental transport can produce 4-18% of the response (impact sensitivity) of the in-source region controls.

  • Health Impacts

– Intercontinental transport of PM may cause 380,000 premature mortalities, globally, 75% of which are attributed to dust.

  • Ecosystem Impacts

– Intercontinental transport of S and N contributes to acidification and eutrophication and changes in surface radiation.

  • Climate Impacts

– PM contribute significantly to changes in global and regional climate, both positively and negatively, depending on chemical composition, location, timing, and background composition. Black carbon deposition on snow and ice is understood to be a particularly important positive forcing, especially for the Arctic and the Himalyan regions.

slide-15
SLIDE 15

15

Dentener, HTAP, Brussels June, 2010 57

A6: Policy Implications

  • Control of foreign sources of ozone and PM is not a substitute for domestic control of ozone

and PM sources.

  • Together, foreign sources contribute to significant adverse public health, natural and agricultural

ecosystem damage, and near-term climate forcing on regional and global scales.

  • As domestic sources are reduced and AQ standards are tightened, the absolute and relative

importance foreign sources will increase without the implementation of controls. Increasing emissions in other source regions will require greater controls in a given region to meet fixed standards.

  • Controlling emissions generates benefits outside of a given source region, potentially larger

than the benefits within the source region itself.

  • Collective action is needed to decrease emission sources and their various impacts at the local,

regional, hemispheric, and global scales.

Dentener, HTAP, Brussels June, 2010 58

A1: 25 (27) A2: 45 (67) A3: 35 (45) A4: 45 (70; still parts missing) A5: 45 (79) A6: 10 () Total 205 pages Length of Part A