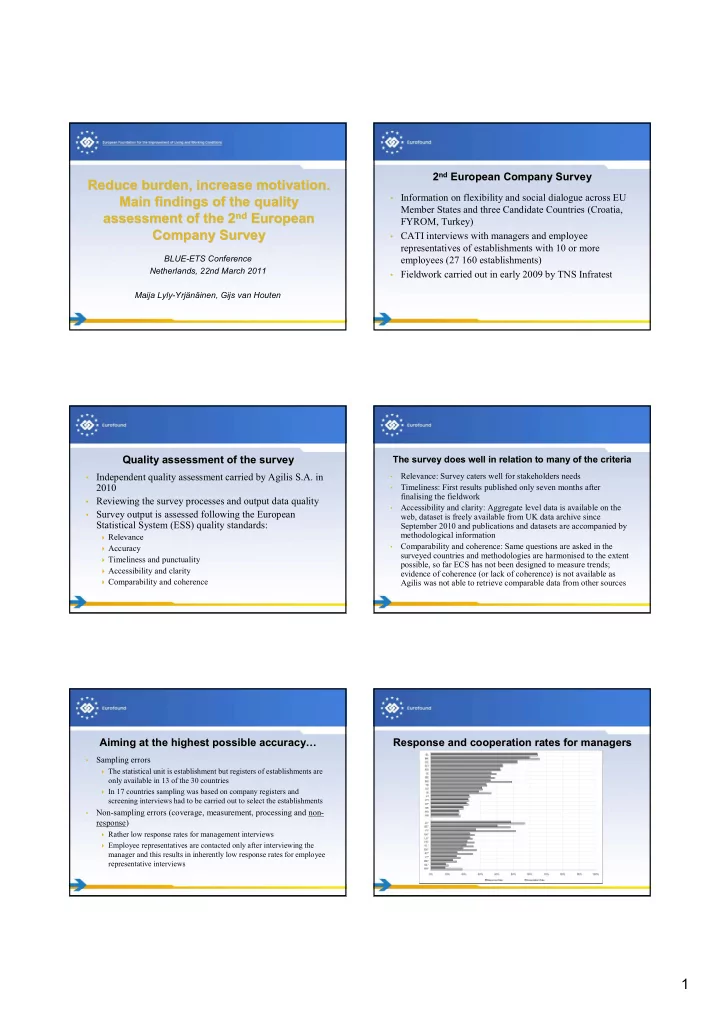
1 Response and cooperation rates for employee Response and - - PDF document

1
SMART_READER_LITE
LIVE PREVIEW

1 Response and cooperation rates for employee Response and - - PDF document

nd European Company Survey 2 nd European Company Survey 2 Reduce burden, increase motivation. Reduce burden, increase motivation. Information on flexibility and social dialogue across EU Main findings of the quality Main findings of the


slide-1
SLIDE 1

1

Reduce burden, increase motivation. Reduce burden, increase motivation. Main findings of the quality Main findings of the quality assessment of the 2 assessment of the 2nd

nd European

European Company Survey Company Survey

BLUE-ETS Conference Netherlands, 22nd March 2011 Maija Lyly-Yrjänäinen, Gijs van Houten

2 2nd

nd European Company Survey

European Company Survey

  • Information on flexibility and social dialogue across EU

Member States and three Candidate Countries (Croatia, FYROM, Turkey)

  • CATI interviews with managers and employee

representatives of establishments with 10 or more employees (27 160 establishments)

  • Fieldwork carried out in early 2009 by TNS Infratest

Quality assessment of the survey Quality assessment of the survey

  • Independent quality assessment carried by Agilis S.A. in

2010

  • Reviewing the survey processes and output data quality
  • Survey output is assessed following the European

Statistical System (ESS) quality standards:

Relevance Accuracy Timeliness and punctuality Accessibility and clarity Comparability and coherence

The survey does well in relation to many of the criteria The survey does well in relation to many of the criteria

  • Relevance: Survey caters well for stakeholders needs
  • Timeliness: First results published only seven months after

finalising the fieldwork

  • Accessibility and clarity: Aggregate level data is available on the

web, dataset is freely available from UK data archive since September 2010 and publications and datasets are accompanied by methodological information

  • Comparability and coherence: Same questions are asked in the

surveyed countries and methodologies are harmonised to the extent possible, so far ECS has not been designed to measure trends; evidence of coherence (or lack of coherence) is not available as Agilis was not able to retrieve comparable data from other sources

Aiming at the highest possible accuracy… Aiming at the highest possible accuracy…

  • Sampling errors

The statistical unit is establishment but registers of establishments are

  • nly available in 13 of the 30 countries

In 17 countries sampling was based on company registers and

screening interviews had to be carried out to select the establishments

  • Non-sampling errors (coverage, measurement, processing and non-

response)

Rather low response rates for management interviews Employee representatives are contacted only after interviewing the

manager and this results in inherently low response rates for employee representative interviews

Response and cooperation rates for managers Response and cooperation rates for managers

slide-2
SLIDE 2

2

Response and cooperation rates for employee Response and cooperation rates for employee representatives representatives

Measures to support survey response Measures to support survey response

  • Questionnaire integrates the concerns of European

governments, employers and employee representatives and the length of the interview is limited (20 minutes for management and 15 minutes for employee representative interviews)

  • Introductory letter was used to support participation
  • Interviewers were well trained to explain the survey’s

aims and to arrange the interviews in flexible manner

  • Fieldwork period was extended as much as possible

Were the measures successful? Were the measures successful?

  • Subjective comparisons of the response rates to survey

response in other recent business or company surveys

Higher rates than usual in AT, BE, CZ, EL, IE, LV – attributed

to recommendation letter, topic of the survey or specific efforts in the fieldwork management

Lower rates than usual in NL and TR – attributed to interaction

between the topic and economic crisis in the Netherlands and to general distrust in surveys and ambivalent attitude towards the EU in Turkey

Non Non-

  • response bias (1)

response bias (1)

  • Exploratory analysis of structure of weights
  • Binary logistic regression analysis of likelihood for MM

to provide ER contact details and likelihood of ER interview taking place

  • Some evidence for overrepresentation of ‘Wholesale and

retail’, ‘Real estate’, ‘Transport and Communication’, ‘Hotels and restaurants’ and ‘Education’ in the sample

Non Non-

  • response bias (2)

response bias (2)

  • Significant factors contributing to allowing/declining the

employee representative interview

Economic situation, structural change at the workplace, one or

more types of employee representation, public/private sector, sector of economic activity, establishment size

  • Significant factors contributing to having the employee

representative interview

One or more types of employee representation, headquarters or

not, public/private sector, establishment size, sector of economic activity, work climate

Some conclusions Some conclusions

  • Improve response rates and data quality by:

Providing explicit methodological guidelines to future contractors,

paying specific attention to securing satisfactory response rates.

Advance notification of enterprises by post or by e-mail informing

them about the forthcoming survey and highlighting its scope.

  • Other less direct avenues:

To collect more data on non respondents (possibly in the contact

sheets), allowing for more in-depth and more systematic non-response analysis.

Exploring the possibilities to reduce respondent burden, by moving to a

multi- or mixed mode approach.

Looking into ways of increasing respondent motivation by providing

customised, individual reports on survey findings, showing results for comparable establishments.

slide-3
SLIDE 3

3

Thank you! Thank you!