1 most common adverse event lymphocytopenia
play

1 Most common adverse event: lymphocytopenia Lymphocytopenia was - PDF document

A Semi-mechanistic Model of Lymphocyte Dynamics in Patients with Multiple Sclerosis Treated with Cladribine Tablets A.L. Quartino (1), P. Girard (2), M.O. Karlsson (1), A. Munafo (2) (1) Dept of Pharmaceutical Biosciences, Uppsala University,


  1. A Semi-mechanistic Model of Lymphocyte Dynamics in Patients with Multiple Sclerosis Treated with Cladribine Tablets A.L. Quartino (1), P. Girard (2), M.O. Karlsson (1), A. Munafo (2) (1) Dept of Pharmaceutical Biosciences, Uppsala University, Uppsala, Sweden; (2) Modeling and Simulation, Merck Serono S.A. – Geneva, Switzerland* *An affiliate of Merck KGaA, Darmstadt, Germany 
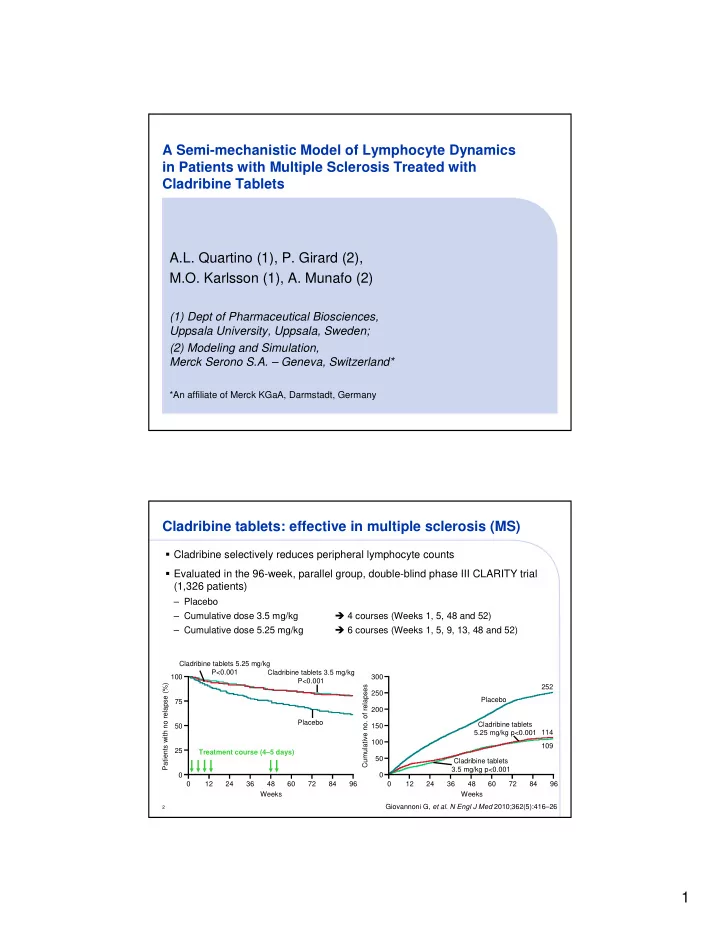
Cladribine tablets: effective in multiple sclerosis (MS) � Cladribine selectively reduces peripheral lymphocyte counts � Evaluated in the 96-week, parallel group, double-blind phase III CLARITY trial (1,326 patients) – Placebo � 4 courses (Weeks 1, 5, 48 and 52) – Cumulative dose 3.5 mg/kg � 6 courses (Weeks 1, 5, 9, 13, 48 and 52) – Cumulative dose 5.25 mg/kg Cladribine tablets 5.25 mg/kg P<0.001 Cladribine tablets 3.5 mg/kg 100 300 P<0.001 Patients with no relapse (%) Cumulative no. of relapses 252 250 Placebo 75 200 Placebo Cladribine tablets 50 150 5.25 mg/kg p<0.001 114 100 109 25 Treatment course (4–5 days) 50 Cladribine tablets 3.5 mg/kg p<0.001 0 0 0 12 24 36 48 60 72 84 96 0 12 24 36 48 60 72 84 96 Weeks Weeks Giovannoni G, et al. N Engl J Med 2010;362(5):416–26 2 1

  2. Most common adverse event: lymphocytopenia � Lymphocytopenia was mostly graded as mild or moderate � Infection rates may increase with severe lymphocytopenia (below CTCAE Grade 2) Mean and observed ALC values in each patient over time The dotted blue line represents the lower limit of CTCAE Grade 1 lymphopenia Placebo 10 3.5 mg/kg group 5.25 mg/kg group Lymphocyte count (*10 9 /L) 5 4 3 2 1 0.5 0.1 0 12 24 36 48 60 72 84 96 0 12 24 36 48 60 72 84 96 0 12 24 36 48 60 72 84 96 Time after dose (weeks) Treatment course (4–5 days) ALC, absolute lymphocyte count; CTCAE, Common Terminology Criteria for Adverse Events 3 Rationale and objectives of ALC model and simulator � Treatment delay may be necessary in a few cases to allow recovery of ALC to above CTCAE Grade 2 and prevent the development of severe lymphopenia – Need for a tool to evaluate the potential impact of treatment delay � Identify a predictive model for ALC � Build a simulator for evaluation of – Lymphocyte dynamics in the rare cases of patients requiring treatment delay – Proportion of patients showing Grade 2 and over, and their recovery time – Percentage of patient completing treatments 4 2

  3. Initial model for ALC � Based on myelosuppression model 1 – Cladribine myelosuppression reversible effect – + Cumulative cladribine non-reversible effect – + Gender, body weight and creatinine clearance (CRCL) covariate influence A max * Dose cum /CRCL max E Clad, cum = A ALC 0 γ 0 γ γ γ γ γ γ γ 50 + Dose cum /CRCL Feedback = Feedback = ALC t Non-mitotic compartments Non-mitotic compartments T½ Blood k circ = LN(2) / k tr Proliferating k tr k tr k tr circulation 2 3 cell pool 1 ALC E Clad = = SLOPE * C p MMT =(n+1)/k tr 1. Friberg LE, et al. J Clin Oncol 2002;20:4713–21 5 Typical prediction ALC versus time (typical 67 kg female) 3.5 mg/kg group 5.25 mg/kg group Cumulative drug effect Cumulative drug effect Combined drug effect Combined drug effect Transient drug effect Transient drug effect 2 2 Lymphocyte count (*10 9 /L) 1 1 0.5 0.5 0.25 0.25 0 12 24 36 48 60 72 84 96 0 12 24 36 48 60 72 84 96 Time (weeks) 6 3

  4. VPC looks OK ... The model seems to adequately describe the data and its variability: 2.5, 50 and 97.5 percentiles of observed data and their model-derived 95% CI Placebo 3.5 mg/kg group 5.25 mg/kg group 10 Lymphocyte count (*10 9 /L) 5 4 3 2 1 0.5 0.1 0 12 24 36 48 60 72 84 96 108 0 12 24 36 48 60 72 84 96 108 0 12 24 36 48 60 72 84 96 108 Time after dose (weeks) CI, confidence interval; VPC, Visual Predictive Check 7 But NPC revealed over-estimation of lymphopenia after 1 year Observed and simulated % of Observed and simulated % of lymphopenia grade=0; initial model lymphopenia grade=1; initial model 100 100 0 Patients (%) Patients (%) 0 80 80 0 0 0 60 60 0 00 0 0 0 0 40 0 0 0 40 0 1 1 1 1 1 20 20 1 1 1 1 1 1 1 1 1 1 1 0 0 0 20 40 60 80 0 20 40 60 80 Observed and simulated % of Observed and simulated % of lymphopenia grade=2; initial model lymphopenia grade=3; initial model 100 100 Patients (%) Patients (%) 80 80 60 60 40 40 2 2 2 2 2 2 20 2 20 2 22 3 3 2 2 2 3 3 3 3 3 3 2 2 3 3 3 3 3 3 0 0 3 3 0 20 40 60 80 0 20 40 60 80 Weeks Weeks 0, 1, 2, 3 Observed % of patients with CTCAE grade Cladribine courses ALC check for 3 rd course NPC, Numerical Predictive Check Simulated % of patients 8 4

  5. Model update for ALC � Cladribine myelosuppression reversible effect � + Cumulative cladribine (formerly non-reversible) effect � + Gender, body weight and CRCL covariate influence � + Recovery on cumulative effect Σ [ Dose cum /CRCL *e -K(t-Tdose) ] Σ Σ Σ A max * max E Clad, cum = A 50 Σ Σ [ Dose cum /CRCL *e -K(t-Tdose) ] Σ Σ ALC 0 γ 0 γ γ γ γ γ γ γ 50 + Feedback = ALC t Feedback = Non-mitotic compartments Non-mitotic compartments T½ Blood k circ = LN(2) / k tr Proliferating k tr k tr k tr circulation 2 3 cell pool 1 ALC E Clad = = SLOPE * C p MMT =(n+1)/k tr 9 Model validation: with cumulative AUC recovery Observed and simulated % of Observed and simulated % of lymphopenia grade=0; updated model lymphopenia grade=1; updated model 100 100 � 0 Patients (%) Patients (%) 0 80 80 � 0 0 0 60 60 0 00 0 0 0 0 40 0 0 0 40 0 1 1 1 1 1 20 20 1 1 1 1 1 1 1 1 1 1 1 0 0 0 20 40 60 80 0 20 40 60 80 Observed and simulated % of Observed and simulated % of lymphopenia grade=2; updated model lymphopenia grade=3; updated model 100 100 � Patients (%) Patients (%) 80 80 60 60 40 40 2 2 2 2 2 2 20 2 20 2 22 3 3 2 2 2 2 3 3 3 3 3 3 2 2 3 3 3 3 3 3 0 0 3 3 0 20 40 60 80 0 20 40 60 80 Weeks Weeks 0, 1, 2, 3 Observed % of patients with CTCAE grade Cladribine courses ALC check for 3 rd course Simulated % of patients 10 5

  6. Simulation of ALC model* � Patients may in rare cases need to delay additional courses while their ALC recovers 10 3.5 mg/kg group Lymphocyte count (*10 9 /L) 5 Mean and 4 observed ALC 3 values in each 2 patient over time 1 Lower limit of CTCAE Grade 1 0.5 0.1 0 12 24 36 48 60 72 84 96 Time after dose (weeks) � 10,000 patients resampled from CLARITY study database for gender, body weight, creatinine clearance and baseline ALC � One course of treatment = 5 days of body-weight, dose-adjusted cladribine tablets � No more than 4 courses of treatment per 48 weeks *TS2 (Pharsight, under Windows XP) 11 Model + patient resampling in TS2 200 simulated patients and nominal dose timings Lymphocyte count (1,000/mmˆ 3 ) 4 3 2 1 0 2.0 4.0 6.0 Time (weeks) 12 6

  7. Simulation to estimate percentage of patients in CTCAE Grade 2 at start of courses 2 to 4, and their time to recovery Patients with ≥ Grade 2 lymphopenia, % 30 25 Week 5 Week 49 20 Week 53 15 10 5 0 0 4 8 12 16 20 24 36 48 Week after ≥ Grade 2 observation NB This simulation assumes that if ALC <800 / mm 3 at starting of 2 nd , 3 rd or 4 th course, corresponding to weeks 5, 49 and 53, respectively, no more treatment is given 13 Proportion of patients achieving 1 to 4 courses (simulated data) 80 +11% No postponing 70 Postpone course when ALC <800/mm 3 60 50 Patients % 40 30 -8% 20 -4% 10 0 1 2 3 4 Number of courses 14 7

  8. Conclusions � A model has been developed of lymphocyte dynamics with transient and slowly-recovering effect in patients with multiple sclerosis receiving cladribine tablets treatment � The proposed model can be used to predict ALC dynamics in patients receiving cladribine tablets in a clinical trial or real-life setting � Simulations allow exploration of – % of patients recovering to CTCAE Grade 1 and their recovery time – % of patients completing the full treatment (4 courses over 96 weeks) � The ALC model is being coupled with an efficacy model � It will be further refined with longer observation data 15 Acknowledgements and disclosures � Uppsala University � Merck Serono – Pharmacometrics – Marianne Ekblom, PharmD, PhD – Dan Mikol, MD � This study was funded by Merck Serono S.A. – Geneva, Switzerland* � M Karlsson is a paid consultant for Merck Serono S.A.* � A Munafo and P Girard are employees of Merck Serono S.A.* Cladribine tablets treatment is not approved in the USA. Marketing authorization for the use of cladribine tablets in patients with RRMS has been granted in Russia and Australia (2010). Please refer to full prescribing information for further details on use *An affiliate of Merck KGaA, Darmstadt, Germany 16 8

Download Presentation
Download Policy: The content available on the website is offered to you 'AS IS' for your personal information and use only. It cannot be commercialized, licensed, or distributed on other websites without prior consent from the author. To download a presentation, simply click this link. If you encounter any difficulties during the download process, it's possible that the publisher has removed the file from their server.

Recommend


More recommend