1. - - PDF document

1 focus context taken literally
SMART_READER_LITE
LIVE PREVIEW

1. - - PDF document

1. Focus+Context Taken Literally Kosara, R., Miksch, S., and Hauser, H. Focus+Context Taken Literally, IEEE Computer Graphics and Application. Jan/Feb


slide-1
SLIDE 1

1

1

  • CPSC533C

Chia-Ning Chiang March 22, 2004

2

  • 1. Focus+Context Taken Literally

Kosara, R., Miksch, S., and Hauser, H. “Focus+Context Taken Literally,” IEEE Computer Graphics and Application. Jan/Feb 2002, p. 22-29.

  • 2. Continuous Zooming

The Continuous Zoom: A Constrained Fisheye Technique for Viewing and Navigating Large Information Spaces L. Bartram, A. Ho, J. Dill and F. Henigman, UIST '95, pp. 207-216

  • DateLens

DateLens: A Fisheye Calendar Interface for PDAs Benjamin B. Bederson, Clamage, A., Czerwinski, M. P., & Robertson, G. G. ACM Transactions on Computer-Human Interaction (TOCHI), March 2004, 11(1), pp 59-89.

3

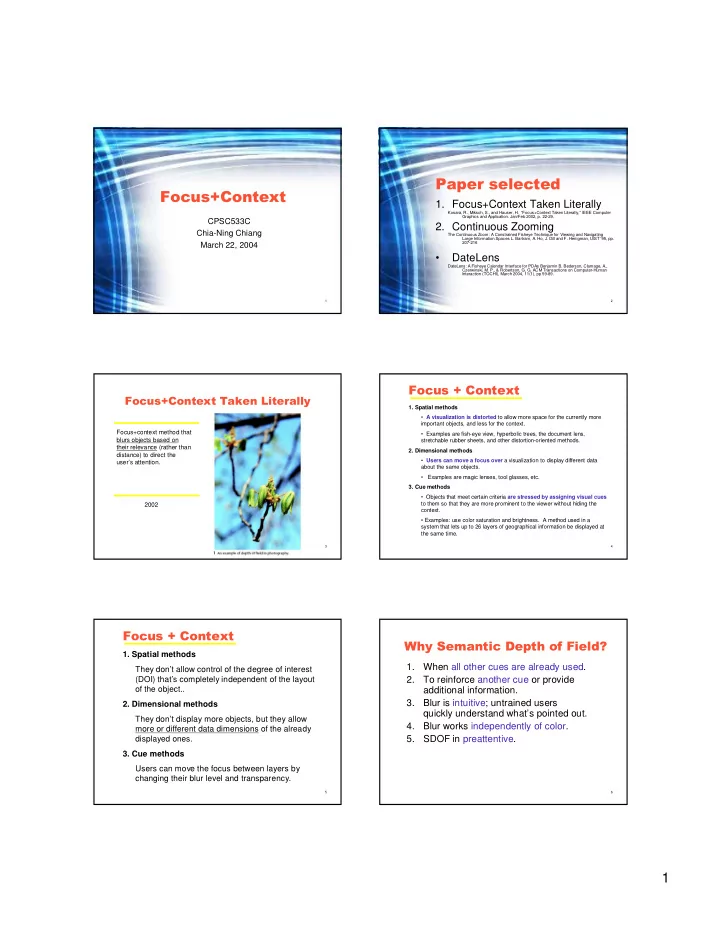
  • Focus+context method that

blurs objects based on their relevance (rather than distance) to direct the user’s attention. 2002

4

  • 1. Spatial methods
  • A visualization is distorted to allow more space for the currently more

important objects, and less for the context.

  • Examples are fish-eye view, hyperbolic trees, the document lens,

stretchable rubber sheets, and other distortion-oriented methods.

  • 2. Dimensional methods
  • Users can move a focus over a visualization to display different data

about the same objects.

  • Examples are magic lenses, tool glasses, etc.
  • 3. Cue methods
  • Objects that meet certain criteria are stressed by assigning visual cues

to them so that they are more prominent to the viewer without hiding the context.

  • Examples: use color saturation and brightness. A method used in a

system that lets up to 26 layers of geographical information be displayed at the same time.

5

  • 1. Spatial methods

They don’t allow control of the degree of interest (DOI) that’s completely independent of the layout

  • f the object..
  • 2. Dimensional methods

They don’t display more objects, but they allow more or different data dimensions of the already displayed ones.

  • 3. Cue methods

Users can move the focus between layers by changing their blur level and transparency.

6

  • 1.

When all other cues are already used. 2. To reinforce another cue or provide additional information. 3. Blur is intuitive; untrained users quickly understand what’s pointed out. 4. Blur works independently of color. 5. SDOF in preattentive.

slide-2
SLIDE 2

2

7

  • Depth of Field (DOF)
  • Blurring the less relevant

parts of the display while sharply display the relevant information. Semantic Depth of Field (SDOF)

  • - A focus+context method that

blurs objects based on their relevance (rather than distance) to direct the user’s attention.

The building blocks of SDOF (Kosara et al, 2001)

Our relevance function resembles the degree of interest (DOI) function. But relevance is completely independent of layout (quite contrast to fisheye views)

8

  • 1. Relevance and blur
  • 2. Properties
  • 3. Applicability
  • 4. Parameterization
  • 5. Interaction

9

!"#$$

%&% Each object or data point is assigned a relevance value r.

  • The relevance value r range

from 0 (means completely irrelevant) and 1 (means maximally relevant).

  • The relevance values are

translated by the blur function into a blur value b.

  • The blur function is determined

by the threshold t, the step height h, and the maximum blur diameter bmax.

  • The gradient g is calculated by

the application (software). (see Parameterization)

10

' &

  • SDOF is intuitive, like our field of view.
  • SDOF is Independent of color.
  • SDOF distorts irrelevant objects rather

than relevant ones.

  • Blurring removes the high spatial

frequencies and reduces the contrast.

  • Small details getting lost. (to the context objects,

not a relevant problem)

11

( )*&

  • SDOF suits for some applications than others.
  • SDOF suits applications where objects should be pointed out that are
  • f sufficient size so that they don’t have to be magnified to be shown

to the user. (SDOF doesn't work well with pixel-based visualizations.)

  • SDOF can be used where other visual cues have already been used

and additional ones are needed.

  • SDOF can be used as an intuitive cue when color, saturation, and
  • ther cues are not .
  • SDOF depend on the appearance of blur on the viewing angle, it is

required to have the knowledge about the output device and ways for users to interact with the application.

12

+ ,

  • A means for user to adjust the

parameters of the display or at least use good default values.

  • Users can adjust the values h and the

maximum blur diameter bmax In the blur

  • function. (limits of the usable blur)
  • Users can change the threshold t as
  • ften as necessary to show different

amount of objects in focus while examining data.

slide-3
SLIDE 3

3

13

  • .
  • A means to adjust the parameters
  • f the display or at least use good

default values.

  • Users can adjust the values h and

the maximum blur diameter bmax In the blur function.

14

&)

  • 1. LesSDOF
  • 2. sfsv
  • 3. sscater
  • 4. sMapViewer

15

&/Text display and keyword search

Scrolling in LesSDOF. Three lines on the top are context from the last page, and therefore blurred, but still readable. Finding a keyword in LesSDOF. Three hits appear on this page, with the focus currently on the middle one.

16

SDOF aspects.

  • The application only uses a binary relevance

classification.

  • Blur and other cues reinforce each other.
  • This example doesn't use any color and still

effective in guiding the viewer’s attention.

&/Text display and keyword search

Interaction.

  • Users can’t influence either the relevance or the blur function.
  • Minimum perceivable blur, when paging through a text.

17

' "/01

A file system viewer with all files in focus. A file system viewer with

  • ne focusing on the files
  • f one user

18

' "/01

SDOF aspects and Interaction:

  • SDOF can be used as an orthogonal cue and

reinforcement, depending on the user’s needs.

  • The combination of cues allow to find file in their

context.

  • It is poor to quickly look for different information in a

directory or directory structure without loosing the context.

slide-4
SLIDE 4

4

19

( /

20

( /

SDOF aspects and Interaction:

  • Users are free to choose data dimensions for SDOF display,

several relevance measures can apply:

—Binary (such as availability of manual transmission) —Discrete (such as number of cylinders) —Continuous (such as price, engine size,…)

  • Scatter plots are useful to get overview for data and test

hypothesis.

  • But scatter plots are only useful for two data dimensions.
  • A large number of easily distinguishable cues are therefore

needed.

21

+ 2 01

  • Users stack layers of

geographical information

  • n top of each other.
  • The topmost layer is

displayed sharply, while all

  • ther layers are

increasingly blurred.

  • It creates a sense of

depth. SDOF aspects: The possibility of defining a continuous relevance function. Interaction: Users can select the layer to be put on top of the stack.

22

.

  • Modern graphics hardware support blurred image

quickly and usable in interactive applications. (texture mapping, e.g. in computer games)

  • They draw an image several times at slightly different

positions and having the graphics hardware sum up the color information at every step.

  • Blurring sums up the information around a pixel for

every pixel in the image.

  • Calculate auxiliary sums and then sum up in a second

step.

23

3/" %

Giller, V. et al., Experimental Evaluation of Semantic Depth of Field, a Preattentive Method for Focus+Context Visualization, tech. report TR-VRVis-2001-021, VRVis Research Center, Austria, 2001, http://www.vrvis.at/. Example: 1. A portrait (left) - the blurred objects surrounding the face are hardly noticeable; 2. The object different to all others is immediately perceived (top right); 3. text is another example (bottom right).

16 subjects were able to detect and locate objects (up to 63 distractors) for only 200 ms (with more than 90% accuracies), they were able to estimate the no. of sharp objects.

24

4

  • Pros:

– SDOF is preattentive. – SDOF is useful for discriminating a small number of

  • classes. ( 3 or 4 – subject to further tests )

– No difference in search time between blur and color.

  • Cons:

– Can’t use SDOF as a fully fledged visualization dimension

  • Tiring to tell the difference in blur between blurred objects
  • Not able to tell that difference in any meaningful way.
  • Future Work

– How well SDOF works together with Focus+Context techniques. – How SDOF can be applied to areas such as volume and flow visualization and user interface.

slide-5
SLIDE 5

5

25

5

  • A well structured and well-written
  • verview article.
  • Reference to previous work on SDOF

and user study; provides the website link for further studies.

  • Gives definition, applications,

implementation, user study, and conclusion and future work.

  • Lack of technical details on

implementation part.

26

6

In large real time systems such as power generation/distribution, telecommunications and process control.

(1995)

27

7

  • A better way in navigating and viewing

large information spaces

– Supports multiple focus points; – Enhances continuity through smooth transitions between views, and – Maintains location constraints to reduce the user’s sense of spatial disorientation.

28

6

  • Uses both filtering and distortion, and

Graphical Fisheye to create detail-in-context views.

  • Creates a graphic interpretation of Furnas’s

filtering method using compression as well as removal.

  • Deals with a large network depicted as a

collection of non-overlapping rectangles connected by links. When the user make a rectangle grow , the other rectangles in the network shrink.

  • using a fisheye algorithm that takes into

account the network proximity.

29

6)

30

6)

  • The entire hierarchy is visible at all times (though

some times “summarized” by closed clusters)

  • The detailed portions always appear in context.
  • Multiple areas can be zoomed simultaneously (more

than one focal point)

slide-6
SLIDE 6

6

31

6) 1

32

6) 1

33

6)

Mechanism

– The node size shows a DOI that each node maintains. –The arcs (links) of the network are always draw on top of the nodes – Holding the mouse button to increase or decrease the size

  • f the node until the button is released.

– DOIs are dynamically calculated based on a node’s a priori importance, its current sate and its proximity to interesting nodes. –The neighbors of interesting nodes get more space than nodes farther away.

34

6)%

  • The initial layout of the network (normal geometry)

– The initial layout is constant. –The display is controlled by changing scale factors. – A “budgeting” process to distribute space among the nodes of a network.

  • Subsequent DOI-based size adjustments (A set of scale

factors) – A scale factor for each node controls the node’s size. – A scale factor is first computed for every interval. – Whenever a node size changes the new representation is automatically given the largest size possible based on its min size requirement, on its DOI and on available space.

  • The two are combined to produce the zoomed geometry.
  • The algorithm works independently in the X and Y axes.

35

1. The node size changes, but stay within their intervals; however, node projections may overlap; 2. The interval size shifts, but they never

  • verlap;

3. After computing, the nodes are repositioned; 4. After reposition, a nodes’ center stays at the same relative position in its interval.

36

%

  • Combine global A hybrid continuous

zoom

  • The global algorithm is applied to the

subtree rooted above the node being scaled.

  • Sizing based on DOI

– Stop as soon as any node become too small. – Augmenting the basic algorithm with a two- stage calculation.

slide-7
SLIDE 7

7

37

  • The animation does suffer from certain

discontinuities in motion.

  • The free space allocation to nodes based on their

DOIs can let let some space go to waste.

  • The scalability of this technique has not yet fully

explored by the authors.

  • How hierarchical structures may be used to

represent links and how the algorithms may be extended to support space allocation and navigation issues in the link space as well as in the node space need further studies.

  • Full filtering is not supported in the continuous

zoom.

38

5

  • Research questions are clearly defined.
  • Detailed descriptions on approaches,

algorithm, and discussion.

  • The dynamically calculation was a

pioneer approach due to the computer technology then.

  • No user study.
  • No quantifiable evidences provided to

explain test results. (about 5 steps seem to be sufficient)

  • Illustrations do not demonstrate its

application a large information space.

  • No qualitative data too. (in the opinion of our users)

39

  • 2004

40

  • A conventional

calendar information

  • Fisheye distortion

technique

  • Zooming interaction

41

  • A conventional calendar employs Fisheye

distortion and along with Zooming interface

  • Tasks including scheduling, navigate and

counting, and searching

– Picking a good weekend to camping – Counting the number of Mondays in November – Finding start and end dates of a trip

  • Support from PDA and up to Desktop

– The ability to switch between devices

42

3

  • Two user studies at

Microsoft Research – First with non-PDA users – Second with MSR PDA-using employees

  • Similar timing results
  • Overall quite

enthusiastic

Interaction between Calendar Type and Task Complexity

10 20 30 40 50 60 70 80 90 Condition Average Task Time (Seconds) DateLens--Simple PPC--Simple DateLens--Complex PPC--Complex

Bederson, 2004

slide-8
SLIDE 8

8

43

  • Improve usability issues
  • Fulfill User requested functions

– Such as faster data entry

  • Tease apart the individual influences of

integrated search and the flexible, fisheye visualization to complex tasks

  • Apply DateLens interface to smaller devices

(such as cell phones) and larger ones (such as tiled displays)

44

  • Does zooming work?
  • Is animation helpful?
  • Are toolkits beneficial?
  • => Clearly yes (sometimes)

– Good small representations needed – Animation to help maintain object constancy best – Understanding of domain and users crucial

  • Like all interfaces, good visualizations

remain hard

45

  • Video

(http://www.cs.umd.edu/hcil/datelens/d atelens-video-web-server.wmv)

  • Demo

http://www.windsorinterfaces.com/datelens- demo.html

  • Commercialized at www.datelens.com

46

5

  • This paper gives an overall review of

researches of a design (now it is a commercialized

product).

  • Comprehensive, well-structured, well-

written, and well-illustrated.

  • Contains both quantitative and

qualitative studies.

  • Detailed reports on user studies.
  • No technical details.
  • Two user studies, but limited to the

design team because of privacy concern.