1.1. Sales Commissions Sales Commissions 1.1. Business *New - - PowerPoint PPT Presentation

1 1 sales commissions sales commissions 1 1
SMART_READER_LITE
LIVE PREVIEW

1.1. Sales Commissions Sales Commissions 1.1. Business *New - - PowerPoint PPT Presentation

au 1.1. Sales Commissions Sales Commissions 1.1. Business *New purchases yen Average commissions /unit* & upgrade models 45,000 40,000 35,000 30,000 0 1Q 2Q 3Q 4Q 1Q FY2005.3 FY2006.3 FY2005.3 FY2006.3(E) 1Q


slide-1
SLIDE 1

9

“au” Business

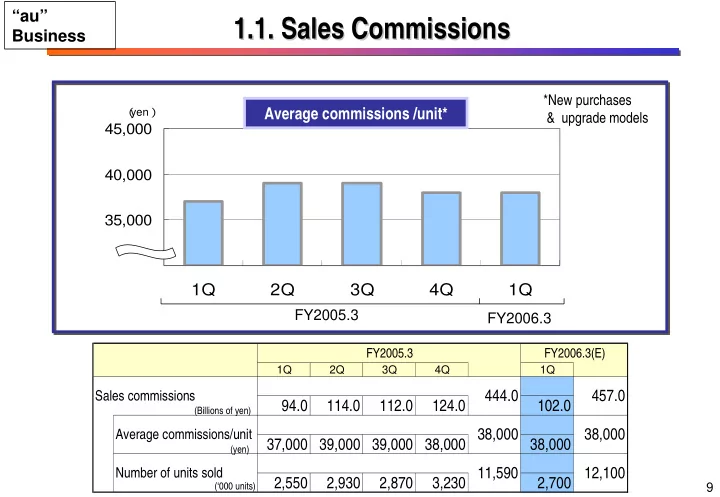
1.1. 1.1. Sales Commissions Sales Commissions

30,000 35,000 40,000 45,000

1Q 2Q 3Q 4Q 1Q

FY2005.3 FY2006.3 *New purchases & upgrade models

( yen)

Average commissions /unit*

(Billions of yen) (yen) (‘000 units)

FY2005.3 FY2006.3(E)

1Q 2Q 3Q 4Q 1Q

94.0 114.0 112.0 124.0 102.0 37,000 39,000 39,000 38,000 38,000 2,550 2,930 2,870 3,230 2,700 11,590

Number of units sold

444.0

Average commissions/unit

38,000 457.0 38,000 12,100

Sales commissions

slide-2
SLIDE 2

10

“au” Business

1.2. 1.2. Net Adds & Churn Rate Net Adds & Churn Rate

0% 20% 40% 60% 80% 100% 3/'04 6/'04 9/'04 12/'04 3/'05 6/0'5 100 200 300 400 500

1.49% 1.26% 1.37% 1.51% 1.40%

0.0% 0.5% 1.0% 1.5% 2.0%

1Q 2Q 3Q 4Q 1Q

<1.44%>

Improved 0.14 points yoy

<50.4%> <22.5%> <53.8%> <22.8%>

( ’000subs) ( Market share)

Net Adds Churn Rate

FY2005.3 Full-year FY2006.3

full-year/FY2005.3 1Q/FY2006.3

Net Adds Total subs

Net Adds share Total-sub share Net Adds Share of :

Note: Churn rate is calculated for ordinary handsets which exclude module-type terminals.

slide-3
SLIDE 3

11

1,720 1,730 1,720 1,780 1,810 4,400 3,600 3,520 3,490 5,540 5,570 5,470 5,180 5,020 7,150 7,270 6,970 6,640 6,480 1,790 3,920 5,240

2,000 4,000 6,000 8,000 10,000 12,000 14,000 1Q 2Q 3Q 4Q 1Q 1Q 2Q 3Q 4Q 1Q

Total ARPU WIN ARPU

1.3. 1.3. Trend of Trend of ARPU ARPU

yoy change total ▲¥ 210( ▲ 2.9%)

  • f Voice ▲¥ 300(

▲ 5.4%)

  • f Data + ¥ 90(

+ 5.2%)

11,550 7,260 6,960 7,300 7,190 11,190 10,570

<¥ 7,170> <¥ 5,430> <¥ 1,740>

10,160 6,810 7,050 9,970

“au” Business

Full-year total ARPU

  • f Voice
  • f Data

FY2005.3 FY2006.3 FY2005.3 FY2006.3

FY2006.3 Full-year F Voice Total Data ( yen)

slide-4
SLIDE 4

12

“au” Business

2

  • 2. Measures to Expand Sales of WIN

. Measures to Expand Sales of WIN

Handsets Content & Applications Infrastructure Charges

Expanded lineup More WIN models in the total lineup

August 1, 2004~ Late Nov. 2004~: EZ Chaku Uta FullTM Mid-June 2005~: EZ-TV

Planned EV-DO service coverage End-Sept. 2005: 99.9% nationwide EV-DO Rev.A: commercial launch planned during CY2006

  • Sept. 2005 planned: EZ FeliCa

(in all WIN handsets after FY2006)

May 1, 2005~ Double Teigaku “Light” PCSV flat-rate 〃 ~

(Double Teigaku)

Note: PCSV stands for PC site viewer.

slide-5
SLIDE 5

13

573 1,191 2,032 343 4,319 3,252 79% 77% 83% 81% 83% 87% 0% 20% 40% 60% 80% 100% 3/'04 6/'04 9/'04 12/'04 3/'05 6/'05 1,000 2,000 3,000 4,000 5,000

3

  • 3. Update on

. Update on WIN WIN(1) (1)

Note: Flat-rate take-up ratio at end-June includes Double Teigaku “Light ” subs in line with the launch of service in May 2005. Former Packet-Discount WIN subs, who were automatically shifted into Double Teigaku “Light” after May 2005, account for 6% at end-March 2005.

*

Total subs (right)

“au” Business 3/’06 Target

  • approx. 7,660k

( ‘000 subs)

Flat-rate take-up ratio (left)

Growth of WIN &Flat-rate Subs

■ Expanded flat-rate plan to even wider customer base through commencement of Double Teigaku “Light” in May 2005.

slide-6
SLIDE 6

14

5,240 6,480 1,810 3,490

2,000 4,000 6,000 8,000 10,000 12,000

49% 51%

3

  • 3. Update on WIN (2)

. Update on WIN (2)

ARPU

WIN

7,050 9,970

“au” Business ■ WIN has continued to capture high-end users from other companies with proportion of new subscriptions at around half.

New subscription Upgrades Breakdown of WIN Subs

Note: Percentage of the simple total of subs who sign up in 1Q/FY06.3. Note: ARPU of 1Q/FY06.3.

( yen)

Total ARPU

Voice Total Data

slide-7
SLIDE 7

15 ▲ 2,500 ▲ 2,000 ▲ 1,500 ▲ 1,000 ▲ 500 500 1,000 1,500 12/'03 4/'04 8/'04 12/'04 4/'05

3

  • 3. Update on WIN (3)

. Update on WIN (3)

Cahnges of ARPU : 1X →WIN

Decrease mainly due to high-end users Increase due to more low-end users

“au” Business ■ During launching period, WIN had a negative effect with data high-end users shifting to flat-rate but post-switched ARPU turns to be on a upward trend since DoubleTeigaku (Two-tiered flat-rate plan) was introduced.

Change to Double Teigaku Introduce flat-rate

Note: Comparison of pre- and post-switch monthly ARPU for the month when users switched to WIN. (yen)

slide-8
SLIDE 8

16

“au” Business

4

  • 4. Provision of Attractive Content

. Provision of Attractive Content (1) (1)

■ Steady growth in Chaku-uta FullTM; total downloads topped 10 million on June 15.

2,000 4,000 6,000 8,000 10,000 12,000

11/'04 12 1/'05 2 3 4 5 6

  • No. of Cumulative D/Ls of Chaku-uta FullTM

( ’000 D/Ls)

  • Jan. 5

1 million

  • Apr. 3

5 million June15 10 million

slide-9
SLIDE 9

17

4

  • 4. Provision of Attractive Content

. Provision of Attractive Content (2) (2)

Subs Using Upper Limit of Double Teigaku

Breakdown of Chaku-uta FullTM Subs

( Note 1) ( Note 2)

“au” Business

0% 10% 20% 30% 40%

25% 37% 21% 12% 5% 50s+ (Age) 40s 30s 20s 10s

10s & 20s:

  • approx. 60%

83% 58%

0% 20% 40% 60% 80% 100%

Chaku-uta Full users Non-users

■ Promote churn-in to “au” and increased data ARPU through rich downloadable content such as Chaku-uta FullTM, which is popular among younger agegroups.

Note 1: June 2005 results. Note 2: May 2005 results for Double Teigaku subs who have Chaku-uta Full compatible handsets.

slide-10
SLIDE 10

18

“au” Business

4

  • 4. Provision of Attractive Content

. Provision of Attractive Content (3) (3)

■ Commenced DUOBLOG on May 19; the number of bloggers is on the rise, reaching 19,000 users on a cumulative basis at end-June.

Growth of DUOBLOG

( ’000 P V s) ( users)

500 1,000 1,500 2,000 5/19 5/26 6/2 6/9 6/16 6/23 6/30 5,000 10,000 15,000 20,000

  • No. of bloggers

Total Page Views/day

slide-11
SLIDE 11

19

4 4. . Provision of Provision of Attractive Content Attractive Content (4) (4)

( 16.51M)

  • No. of

blog readers ( 34.55M)

“au” Business ■ Increase chance of contact with mobile phones among larger agegroups and boost data ARPU by enhancing communication-oriented content such as blog.

Blog Market Forecast DUOBLOG Readers

( Note 1) ( Note 2)

0.0 2.0 4.0 6.0 8.0 10.0 2005/3 2007/3

in 2yrs 7.87M 3.35M

bloggers

( users in millions)

15% 33% 31% 14% 7%

0% 10% 20% 30% 40%

10s 20s 30s 40s 50s+

20s & 30s:

  • approx. 60%

Note 1: Results during May 19 - June 12, 2005 (based on unique users). Note 2: Source: “Analysis on Current Status and Forecast on Blogs/SNS” issued by MIC on May 17, 2005. (SNS: Social Networking Service).