
SLIDE 1
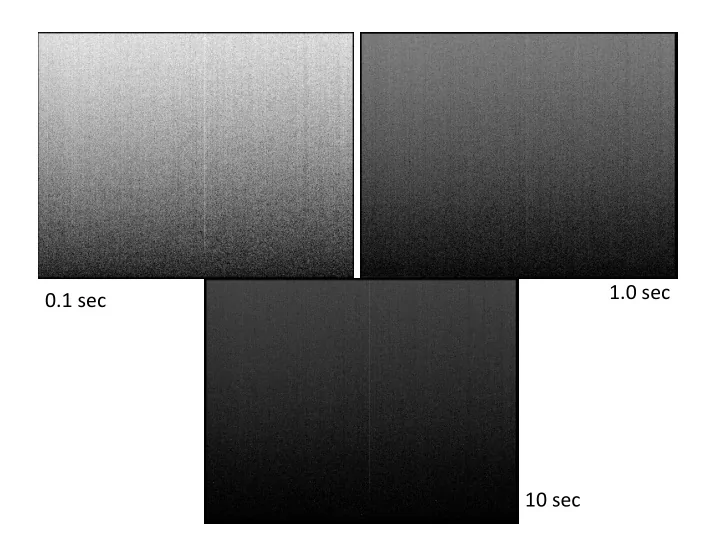
1.0 sec 0.1 sec 10 sec 1.0 sec 0.1 sec Min:500 - - PowerPoint PPT Presentation
1.0 sec 0.1 sec 10 sec 1.0 sec 0.1 sec Min:500 10 sec Max:700 1.0 sec 0.1 sec Min:500 10 sec Max:700 1.0 sec 0.1 sec
* Additives Primary colors are GRB (light is emitted: TV, movies, flames, lasers, LEDs,) Yellow means both green and red rays are present * Subtractive Primary colors are YMC (light is absorbed: Printer, paints, flowers…) Yellow means blue is absorbed from the white light source.
http://www.cudo.jp/e/images/eye1.gif http://www.colorcube.com/articles/basics/1sscurve.gif http://www.amastro2.org/at/ot/othcs.gif
wavelengths ¡
simultaneously ¡
i.e., ¡hundreds ¡of ¡bands ¡
Pushbroom ¡imaging ¡spectrometer: ¡detector ¡ uses ¡moHon ¡of ¡spacecra[ ¡to ¡image ¡in ¡2D ¡
Filter ¡wheel ¡imaging ¡spectrometer: ¡Image ¡ for ¡each ¡filter, ¡images ¡must ¡overlap ¡ Whiskbroom ¡imaging ¡spectrometer: ¡ detector ¡uses ¡moHon ¡of ¡spacecra[ ¡and ¡ sideways ¡scanning ¡mirror ¡to ¡image ¡in ¡2D ¡
Index of Ref. or Extinction Coeff. Reflectance n: index of refraction is a measure of the speed of light in a substance K: extinction coefficient, related to absorption coefficient (k) by k = 4 pi K/
n and k control scattering and absorption properties of materials; these are often referred to as the ‘optical constants’ (though they are not constant!)
High ¡index ¡of ¡refracHon ¡– ¡n ¡> ¡2.5 ¡ Low ¡index ¡of ¡refracHon ¡– ¡n ¡ Close ¡to ¡1 ¡
Adding small amounts of a highly absorbing material can have dramatic effects on reflectance spectra, including suppression of strong absorption bands.