
SLIDE 1
0 Presentation Title Presentation for the Annual General Meeting - - PowerPoint PPT Presentation
0 Presentation Title Presentation for the Annual General Meeting Presentation Subtitle Anil Sardana Managing Director 24 August 2011 1 Agenda Overview of Tata Power Sustainability Strategy Fuel De-risking Strategy
1
2
6.6
16% 34% 6% 33% 4% 4% 3%
Revenue by business segments Listed Companies Tata Consultancy Services Tata Motors Tata Steel Tata Power Titan Tata Chemicals Tata Communications Indian Hotels Tata Global Beverages Voltas Rallis Tata Elxsi Trent 51.8 14.4 12.4 4.5 2.1 1.4 1.4 1.3 1.2 0.4 0.2 0.5
Revenue FY 2010 c.INR 3,195bn
Communications and Information systems Engineering Materials Services Energy Consumer Products Chemicals Notes: 1 As of 31 March 2011. Source: BSE website 2 As of 09 June 2011; Conversion rate of 1US$ = INR 44.74. Source: Tata group website
Promoter Shareholding (%)1 74.1 34.8 30.6 31.8 53.5 31.2 76.2 33.6 35.2 30.6 50.7 45.1 31.3 Mkt Cap ($ bn)2
4
Other Businesses
SED Tata BP Solar 49% Tata Projects 48%
Investments
Technical Exergen 5.13% Geodynamics 8.76% Sunengy 15% Financial TTML 7% TTSL 8% Panatone 39.98% Tata Comm 17%
Division Other SPVs Investment % stakes
Trading Power Business
Indonesian Coal Mines (KPC and Arutmin) 30% Mandakini 33% Tubed 40% Trust Energy 100% Tata Power Trading 100% Mumbai
5
Our Scalable Business Model gives us flexibility to expand - Aggressively looking at opportunities for organic and inorganic growth
Distribution &Retail Customer Fuel & Logistics Transmission
Mumbai Delhi: NDPL 51% Trombay Hydro Jojobera Belgaum Haldia Wind Farm s Solar SPV CGPL (Mundra UMPP) 100% Maithon 74% IEL 74% Dagachhu 26% OTP Geothermal 50% Powerlinks 51%
Generation
India Power Business Indonesia Coal Mines Australia Technical Investments
6
Nepal Hydro Project Bhutan Hydro Project
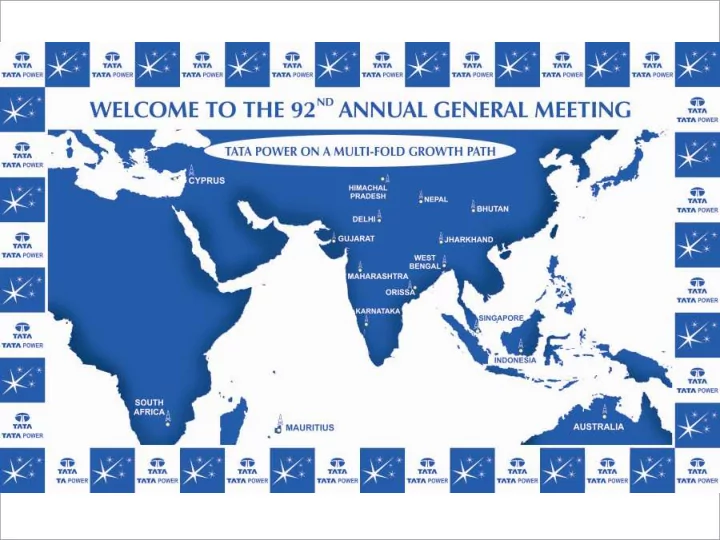
Growth plans in select international geographies chosen to align differentiators and tactical advantages. Plans to grow in specific opportunity turfs covering MENA (Middle East and Africa), Pacific and Far East
Africa and Middle East India and neighbouring SAARC opportunity Pacific and Far East
Fuel and logistics Generation Transmission Distribution 30% equity interest in Indonesian coal mines, KPC and Arutmin Domestic mines under development
–
33.3% stake in Mandakini (7.5 MTPA)
–
40% stake in Tubed (6.0 MTPA)
2 capesize vessels
3 long term charters signed
3,176 MW of
5,341 MW of capacity under implementation Mumbai Transmission network 51:49 JV between Tata Power and Powergrid Corporation of India Ltd Mumbai distribution network 51:49 JV between Tata Power and Govt. of Delhi for distribution in Delhi
7
Integrated Lifecycle Management from Fuel to Retail – Strong presence across the value chain
New business vistas utilizing customer interface management
Power generation capacity (MW)
Thermal 2,974 MW Hydro 447 MW Wind 283 MW Solar 3 MW Transmission Distribution
Operational
Gujarat Karnataka Haldia IEL Mulshi Maharashtra Mumbai Regulated Operations 2,027 MW NDPL Powerlinks Belgaum Jojobera
8
Tamilnadu Maithon
Largest, Most Reliable and Efficient Private Sector Energy Major -
Tata Power commissions Unit#1 (525 MW) of the 1,050 MW Maithon Mega Power Project Powering Expansion Delivered projects speak more than delivered words
Mundra Mithapur Lodhivali DHPC Bhutan Mandakini Tubed
Thermal 4,565 MW Hydro 126 MW Wind 100 MW Solar
35 MW
Coal mines 13.5 MT
Under Execution
Dugar Hydro Kalinganagar
Safety and health Organizational transformation Employee learning & development Developing managers that are stewards of the environment and society, are deeply customer centric, across domains/ functions Buildings and interiors that are friendly, and help create the right culture Energy clubs Customer care centers Demand side management, energy audits Going beyond mere transactions Growth through renewables, clean / green energy Efficient technologies, investments in energy startups Emission and waste reduction Carbon footprint reduction Green buildings Bio-Diversity conservation Resource conservation Principles of community engagement Programs on livelihood, infrastructure and natural resources Helping communities become self-reliant and empowered Participatory development Carbon neutral village clusters
Care for environment Care for community Care for customers Care for people 10
intent to lead the efforts towards a greener world not just internally but also externally through education, engagement and ensuring participation. Key programs that run under Greenolution: Implementation of 100% recycled paper usage in office Tree plantation at all our plants and site locations Saving water at our plants, office and site locations Saving fuel through carpooling and other initiatives Waste Management at our offices Energy conservation and efficiency initiatives at all our locations and outside Reducing air travel and using webcast/video conferencing facilities
Powering a Greener World
11
Tata Power Introduces „Project Sujaan‟ in Gujarat
Hiwell), a JV
Tunda, Vandh, Nana Badhiya and Mota Kandagra. Apart from this, the facility can also be accessed by the adult population of these villages, numbering more than 2,500 persons.
Tata Power‟s Unique Community Initiative Beats the Heat for Nirsa Maithon area
its project site during summer of 2011
Tata Power Provides Increased Income Generation Opportunity to Farmers in Lonavala
farmers
comparison to previous year Tata Power Creates Income Generation Avenues for Womenfolk in Dehrand and Shahapur at Maharashtra
villages
and women of Dherand and Shahapur Tata Power Launches “My Mumbai, Green Mumbai!” Program for its Customers to Encourage Energy Efficiency
large discounts under its Demand Side Management (DSM) efforts
50% reduction in monthly power bills for its customers
Tata Power Unveils The Second Compendium of its Bio-diversity - “Wild Orchids Of Northern Western Ghats”
includes recorded and endemic species present in the Ghats of Maharashtra, Belgaum and Goa
12
Operating Performance Indonesian Coal entities
constitutional amendments, changes in board, material transactions and dividend or other distribution declarations
commissioners and directors and also management committees to handle certain special functions
Operating Performance CY ‟10 CY ‟09 CY „08 Quantity mined (MT) ~60 ~63 ~53 Average Selling Price (FOB USD/ton) ~71 ~63 ~73
Tata Power Company Ltd. (India) Bhivpuri Investments Ltd. (Cyprus) Bhira Investments Ltd. (Mauritius) Indocoal (Cayman Islands) KPC (Indonesia) Arutmin (Indonesia)
100% 100% 30% 30% 30%
14
Our strategic investment ensures complete fuel security in upcoming 4,000 MW imported coal project and your Company will aspire to pursue more of such opportunities. Mandakini Coal Company Ltd. Tubed Coal Mines Ltd.
33% 40%
Mandakini Block (India) Tubed Block (India)
Project Outline:
A (jointly allotted with Jindal Photo Film and Monnet Ispat & Energy - each JV Partner having a share of 2.5 MTP A) at Dist. Angul, Orissa
Project Status:
Control Board.
deposited with IDCO based on demand notice received for acquisition of private land
15
Orissa
Mandakini Coal Block
Project Outline:
A [Jointly allocated with Hindalco at Latehar, Jharkhand Hindalco (60%) 3.6 MTP A & Tata Power (40%) 2.4 MTP A]
Project Status:
Jharkhand
Tubed Coal Block
16
Low cost fuel ensures flexibility across generation business models
Business Structure / Model Capacity (MW) % of overall capacity Returns
Regulated returns 1,927 61% Fixed return
Regulated tariff mechanism (renewables) 277 9% Fixed tariff + PLF driven Captive power plant 668 21% PP A driven (14-19%) Merchant 200 6% Market driven MoU/Bilateral 20 1% PP A driven Case II (for project) 81 3% Bid driven
18
Stable cash flows from existing portfolio of regulated business
10,002 9,845 9,660 8,876 8,200 8,400 8,600 8,800 9,000 9,200 9,400 9,600 9,800 10,000 10,200 FY08 FY09 FY10 FY11
19 Thermal Hydros
Unit Capacity Fuel Unit 4 150 MW Oil & Gas Unit 5 500 MW Coal Unit 6 500 MW Oil & Gas Unit 7 180 MW Gas Unit 8 150 MW Coal Total 1480 MW Location Capacity Khopoli 72 MW Bhivpuri 75 MW Bhira 300 MW Total 447 MW 75 86 84 PLF (%) 37 38 29 PLF (%) Generation (MU) 69 Generation (MU) 33
Mumbai Power is Tata Power – Unmatched uninterrupted power supply
87 95 91 AVF (%) 93
1,489 1,151 1,455 1,310
400 600 800 1,000 1,200 1,400 1,600 FY08 FY09 FY10 FY11
99 99 95 AVF (%) 97
Due to high „Oil‟ price, dispatch of power is restricted from these
working on alternatives.
20
* Remaining 20 MW in Haldia under PPA to WBSEDCL; MUs sold include 20 MW Capacity
Fuel Type
from Hoogly Metcoke) Customer
A with Tata Power Trading Model
Haldia
Capacity
Fuel Type
Customer
A with Tata Power Trading Model
Trombay Unit 8
4.8 5.41 5.06 3.61 2.11 3.38 1 2 3 4 5 6 50 100 150 200 250 MUs sold Realization 5.6 5.4 5.4 4.2 5.3 5.1 1 2 3 4 5 6 20 40 60 80 100 120 140 160 180 200 MUs sold Realization
Upside from presence in merchant market
Generation (MU)
21
Capacity
Fuel Type
Customer
A till 2017 Model
76 80 80 PLF (%)
Jojobera
55 33 63 PLF (%) 82 42
Belgaum
Capacity
Fuel Type
Customer
A till 2012 Model
consistently Generation (MU)
2,862 3,009 3,002 3,078 2,700 2,800 2,900 3,000 3,100 FY08 FY09 FY10 FY11
96 94 93 AVF (%) 97 93 91 79 AVF (%) 82
237 447 394 300 100 200 300 400 500 FY08 FY09 FY10 FY11
Capacity /COD
Fuel Type
Customer
Model
normative basis Generation
IEL PH6
Capacity /COD
Fuel Type
Customer
Model
basis Generation
IEL Unit#5 22
High returns from captive business
Capacity
Customer
3rd Party 21 MW
Tariff Structure FY11 Tariff* (Rs / kwh) Annual Escalation Maharashtra 3.95 Rs 0.15 till 2020 Karnataka 3.40 Nil Gujarat 3.37 Nil Tamilnadu 3.30 Nil
* Effective tariff currently for wind assets is Rs. 3.55/ kwh
23
Generation (MU)
Wind Solar - Mulshi
Capacity/ COD
Customer
A signed with TPC-D for 25 years Generation
20 19 19
PLF (%)
20 Utility company with largest wind portfolio
127 177 320 347 100 200 300 400 FY08 FY09 FY10 FY11
1000 2000 3000 4000 5000 6000 7000 8000 9000 FY05 FY06 FY07 FY08 FY09 FY10 FY11 FY12 FY13
Cumulative capacity at end of year Operational Under Execution
2348 2303 2183 2364 2785 2977 3127 6000 8527
Maithon 1050 MW CGPL 1600 MW Wind 100 MW Lodhivali 40 MW Mithapur 25 MW Mulshi 10 MW CGPL 2400 MW DHPC 126 MW
25
Growing to 3x capacity by FY13 – All projects in advanced stage of construction
UE – Under Execution, UD – Under Development * Gap would be reduced if Phase II projects and possible domestic coal based UMPP come online
26
3,182 MW
Mulshi 10 Tata Motors Rooftop 0.5 Poolavadi 50 Agaswadi 43.5 Mithapur Solar 25 Maithon 1,050 Mundra 4,000 Lodhivali 40 Dagacchu 126 TOTAL 5,345
8,527 MW
Projects in advanced stages of development Thermal 7,450 Renewables 1,000 TOTAL 8,450
~17,000 MW Vision Gap - 8,000 MW*
Poised for fascinating growth
Unit 4 150 Unit 5 500 Unit 6 500 Unit 7 180 Unit 8 250 Bhivpuri 75 Bhira 300 Khopoli 72 Belgaum 81 Wind 283 Haldia 120 Jojobera 428 IEL 240 Mulshi 3 TOTAL 3,182 2,449 5,090 7,450 4,231 19,000 447 126 550 1,377 2,500 286 129 443 2,402 3,500 5,000 10,000 15,000 20,000 25,000 30,000 Operating UE UD Gap Target
27
fuel requirement
prices is over 150%. This will have a price impact of about $ 40 per ton
Selling Price
Government needs to address as local coal cannot meet the growth needs of the Power Sector
issue
29
Capacity
transmission lines Incentive Structure
above Target of 98% Dividend (FY11)
Regulated Equity: Rs 4.64bn RoE: 15.5%
37 84 58
Incentives
PAT (in INR mm.) 51
surplus electricity from the North Eastern States to the North Indian belt
584 653 1081 1060 200 400 600 800 1000 1200 FY08 FY09 FY10 FY11
Successful public private partnership
30
Customer base
consumption FY11 Revenues
FY11 Regulated Equity
ROE%
Incentive Structure
revenue
0% 5% 10% 15% 20% 25% 30% 35% 40% 45% 50% FY03 FY04 FY05 FY06 FY07 FY08 FY09 FY10 FY11 Target Achieved
720 530 790 580 Incentives
the Government of NCT of Delhi 950
1000 2000 3000 4000 FY07 FY08 FY09 FY10 FY11
PAT (in INR mm.) PPP in Distribution - Exemplary performance in reducing AT&C losses
AT&C Losses (%)
Mumbai
17 high-voltage receiving stations
Ampacity
growth in Mumbai
31
about 200,000 retail customer base
Essential, 40% Residential, 4% Commercial, 21% Industrial, 35%
Customer Profile by Sales in MU
6. Mahindra & Mahindra 7. Godrej & Boyce 8. Ordinance Factory 9. BMC Bhandup Complex 10. Mumbai Port Trust 1. Railway 2. RCF Ltd 3. HPCL 4. BARC 5. Mumbai Airport
Top 10 Customers (~40% of capacity)
32
Aspires to be largest distributor of power in Mumbai in MU terms, soon
Strategic Electronics Division (SED) Tata BP Solar
Shipping Subsidiaries
and trading in fuels, Energy Eastern Pte Ltd incorporated for chartering of ships
charters signed, 1 under final stages of negotiation and 2 Korean build vessels purchased for delivery in 2011
modules
installed capacity of 125MW
electronic devices
13 sites
personnel mines
34
36
37
38
39
Target Center & State Target Private Achieved Centre & State Achieved Private Revised Target Center & State Revised Target Private 400 500 600 700 800 900 FY03 FY04 FY05 FY06 FY07 FY08 FY09 FY10 Apr-Dec '10 (BU) Energy demand Energy Supply 13 8 8 10 64 6 5 15 9 5 5 19 18 43 9 15 10 79 37 62 3 3 3 5 1 4 1 20 3 16 11 10 15 20 40 60 80 100 (GW)
XI 5 Year Plan 9MFY11 FY10 FY09 FY08
Source: CEA, Power Scenario at a glance, January 2011
6,586 3,451 2,787 2,462 2,008 1,273 1,117 406 361 90 2,000 4,000 6,000 8,000 Electricity (incl. NCE) Telecommunications Roads & Bridges Irrigation (incl. Watershed) Railways (incl. MRTS) Oil & gas pipelines Water Supply & Sanitation Ports (incl. Inland waterways) Airports Storage (INR bn) 734 2,232 2,453 6,067 6,443 7,148 7,703 8,072 11,174 13,647 17,053 2,000 4,000 6,000 8,000 10,000 12,000 14,000 16,000 18,000 India Brazil China UK Russia Germany France Japan Australia US Canada (KWh)
India suffers from an energy deficit Low per capita consumption of electricity (2008)
Source: IEA, Key World Statistics 2010 (RoW), CEA (India)
Proposed investment during the XIth five-year plan – 32% towards electricity Projected capacity addition in the coming years
8.8%
Source: Planning commission Source: CEA, Mid-Term Appraisal of the Eleventh Five Year Plan
High GDP growth in India, power shortages, rising per-capita consumption and projected capacity addition results in a large potential for growth in the power sector 41
Hydro 22% Thermal 65% Nuclear 3% Renewable 10% 16.9 16.9 17.9 22.0 21.1 23.5 32.6 12.0 21.7 25.2 27.8 35.0 44.3 50.3 0.0 10.0 20.0 30.0 40.0 50.0 60.0 FY05 FY06 FY07 FY08 FY09 FY10 FY11E Million Tonnes Coking Coal Non-coking coal
Source: Ministry of Coal, Annual Report 2009-10
Current installed capacity – large requirement for coal Coal usage by sector in India Coal supply and demand Growth in imported coal in India
Source: Ministry of Coal, Annual Report 2009-10 Note: Power (Utility) includes coking and non-coking coal feed to washery and Bina deshaling plant Steel includes coking coal to feed washeries, direct feed, blendable to steel plants, coke ovens, private cokeries and NLW coke to cokeries Source: Ministry of Coal, Annual Plan 2010-11
India currently has and is projected to have a deficit in coal with the shortfall being filled by imported coal
Source: CEA
Power (Captive) 8% Power (Utility) 71% Steel 2% Cement 2% Fertilizer 1% Others 16% Coal Gas 83% 16% 1% Diesel 454 490 515 573 630 504 546 582 656 713 9.9% 10.3% 11.6% 11.7% 12.6% 100 200 300 400 500 600 700 800 900 1,000 FY08 FY09 FY10 FY11E FY12E Million Tonnes 0% 2% 4% 6% 8% 10% 12% 14% Shortfall (%) Indigenous Supply Demand Shortfall (in terms of demand)
42
* Analyst estimates for shortfall increases in CY12 to about 110 MT (20%)
*