Work Zones About The Research FDOT Grant No. BDB-11 Report Title - - PowerPoint PPT Presentation

work zones about the research
SMART_READER_LITE
LIVE PREVIEW

Work Zones About The Research FDOT Grant No. BDB-11 Report Title - - PowerPoint PPT Presentation

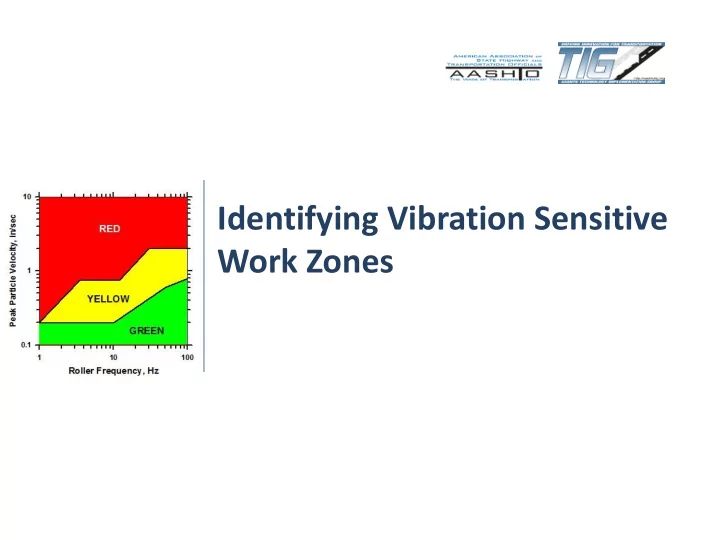
Identifying Vibration Sensitive Work Zones About The Research FDOT Grant No. BDB-11 Report Title Use of Nondestructive Techniques to Estimate the Allowable Vibratory Compaction Level During Construction. Authors N. Mike


slide-1
SLIDE 1

Identifying Vibration Sensitive Work Zones

slide-2
SLIDE 2

About The Research

  • FDOT Grant No. BDB-11
  • Report Title

 Use of Nondestructive Techniques to Estimate the Allowable Vibratory Compaction Level During Construction.

  • Authors

 N. Mike Jackson, Ph.D., P.E., University of North Florida  Michael Hammons, Ph.D., P.E., Applied Research Associates.  Robert Walker, Applied Research Associates.  Harold Von Quintus, P.E., Applied Research Associates.

  • Research Report Available Online at

 http://www.dot.state.fl.us/research-center/Completed_StateMaterials.htm

2

slide-3
SLIDE 3

Background

  • Asphalt Density

 Critical for Pavement Performance  Quality Control Criteria for Hot Mix Asphalt

  • Compaction of Asphalt

 Static Rollers  Vibratory Rollers – Construction Vibration

3

slide-4
SLIDE 4
  • Human Annoyance
  • Infrastructure Damage

 Architectural  Structural

Construction Vibration

slide-5
SLIDE 5

Types of Waves

5

P-Wave or Compression Wave (Seismic Body Wave) S-Wave or Shear Wave (Seismic Body Wave) Rayleigh or Surface Wave (Seismic Surface Wave)

Push-Pull motion

Wavelength Double Amplitude

slide-6
SLIDE 6

6

Construction Induced Vibrations

Energy Carried By Different Waves P-Wave S-Wave Rayleigh Wave

slide-7
SLIDE 7

Falling Weight Deflectometer

7

Time Deflection

  • r particle

velocity

Surface Waves Surface Waves

Sensor Locations

slide-8
SLIDE 8

FWD vs. Roller

  • Falling Weight Deflectometer

– Impact Load (Falling weight) – Peak load range: 1.5 to 27 kips – Typical peak load magnitude = 9 kips

  • Vibratory Roller

– Continuous vibration – Operating weight range: 3 to 30 kips

  • Both induce ground vibration!
slide-9
SLIDE 9

Identification of Vibration Sensitive Areas

  • A practical methodology for identifying vibration

sensitive areas

– Vibratory compaction not recommended

  • Use FWD time histories to predict the ground
  • scillation from vibratory rollers

9

slide-10
SLIDE 10

Vibration Descriptor

  • Peak Particle Velocity (PPV)

Correlates well with damage and complaints Particle movement is mostly in vertical direction Measured by Falling Weight Deflectometer

10

slide-11
SLIDE 11

Prediction of Ground Motion

11

0.1 1 10 0.10 1.00 10.00

Peak Particle Velocity Distance or Sensor Offset Normalized (Scaled) Distance Peak Particle Velocity

0.1 1 10 0.10 1.00 10.00

Normalize the distance by the square root energy scaling law

slide-12
SLIDE 12

Ground Motion Predictor Curve

  • Upper 95% Confidence Interval of curve fitted

through FWD data

0.01 0.1 1 10 0.1 1 10 Scaled Range ft/(ft-lb)^0.5 Peak Particle Velocity, in/se

slide-13
SLIDE 13

Vibration Criteria

  • Human perception

– Subjective; depends upon individuals and circumstances

  • Human annoyance

– Subjective; uncomfortable for some individuals

  • Architectural damage

– Superficial damage such as hairline cracks in plaster

  • Structural damage

– Cracking in foundation, separation of masonry blocks, etc.

13

slide-14
SLIDE 14

Office of Surface Mines – US Bureau of Mines

  • Based on Architectural

damage of low-rise residential structures

  • Most often cited criteria
  • Used by FDOT for pile

driving

14 0.1 1 10 1 10 100 Vibration Frequency, Hz Peak Particle Velocity, in/se Maximum Allowable PPV

Architectural Damage Possible

slide-15
SLIDE 15

DIN 4150 (Germany)

  • Based on human

annoyance

  • Recognizes two settings:

– Offices and factories – Residencial areas

15 0.1 1 10 1 10 100 Vibration Frequency, Hz Peak Particle Velocity, in/se Maximum Allowable PPV for Residential Areas Maximum Allowable PPV for Offices and Factories

slide-16
SLIDE 16

Criteria Adopted by FDOT

16

  • Red – Architectural damage

possible

  • Yellow – People may be

annoyed, but architectural damage unlikely

  • Green - People may perceive

vibration, but annoyance is unlikely

German DIN 4150 Criteria US OSM Criteria

slide-17
SLIDE 17

Analysis Procedures

17

Use FWD to characterize site Predictor Curve

FWD

CRITERIA Operating Frequency of vibratory roller Convert scaled range to actual distance using the energy of the vibratory roller Obtain PPV threshold

slide-18
SLIDE 18

Field Verification

  • Re-Paving Accelerated Pavement Test Tracks at the State Materials Office
  • f the Florida Department of Transportation

18

slide-19
SLIDE 19

Vibration Monitoring Plan

19

LANE 2 LANE 5 LANE 3 LANE 4 LANE 6 LANE 7

N

LANE1 5303 5532 5401 5298 5304 5305 5304 Unit Number Fixed Unit Moving Unit (Relocated as paving

  • perations

moved from lane to lane)

LEGEND Units 5401 and 5532 were set to record full time histories

LANE 2 LANE 5 LANE 3 LANE 4 LANE 6 LANE 7

N

LANE1 5303 5532 5401 5298 5304 5305 5304 Unit Number Fixed Unit Moving Unit (Relocated as paving

  • perations

moved from lane to lane)

LEGEND Units 5401 and 5532 were set to record full time histories

Office Building

slide-20
SLIDE 20

Caterpillar CB-634C

20

slide-21
SLIDE 21

Scaled Vibration From Compactor

21

0.01 0.1 1 10 0.1 1 10 Scaled Range ft/(ft-lb)^0.5 Peak Particle Velocity, in/se

slide-22
SLIDE 22

FDOT Example

  • Public Complaint
  • Increased Vibration

after Patch Installation

  • Human Annoyance
  • Plaster Wall Damage

Asphalt Patch

slide-23
SLIDE 23

FWD Survey Results

  • 18 kip Single Axle Modeled
  • Building is Approx. 90 ft. from Pavement Edge
  • In Green Zone!!
slide-24
SLIDE 24

Vibration Monitor Results

  • Vibration Monitored

– 2 Monitors Set to Report PPV and Frequency – 2 different Days

  • All PPVs in Green zone

0.001 0.01 0.1 1 10 1 10 100 Peak Particle Velocity (in/sec) Frequency (Hz) On Brick Entrance to Office In Hedge by Entrance 0.001 0.010 0.100 1.000 10.000 1 10 100 Peak Particle Velocity (in/sec) Frequency (Hz) On Brick Entrance to Office On Entrance Driveway

DAY 1 DAY 2

slide-25
SLIDE 25

Conclusion - FDOT Example

  • Building is in the

Green Zone

  • Architectural Damage

Unlikely

slide-26
SLIDE 26

Implementation of Algorithm

26