Why survey research? Research Experience (SRE) Working with - - PDF document

why survey research
SMART_READER_LITE
LIVE PREVIEW

Why survey research? Research Experience (SRE) Working with - - PDF document

Using Survey Research to Teach Quantitative Reasoning 10/29/2018 CUNY Student Characteristics (201617) Using Survey Research to Teach Quantitative Reasoning Minority Female Low First Care Work Esther Isabelle Wilder Department of


slide-1
SLIDE 1

Using Survey Research to Teach Quantitative Reasoning 10/29/2018 2018‐NNN‐Wilder‐Remler‐Slides.pdf 1

Using Survey Research to Teach Quantitative Reasoning

Esther Isabelle Wilder Department of Sociology Lehman College, City University of New York Dahlia Remler Marxe School of Public and International Affairs Baruch College, City University of New York A Presentation Prepared for the National Numeracy Network (NNN) Annual Conference East Lansing, MI

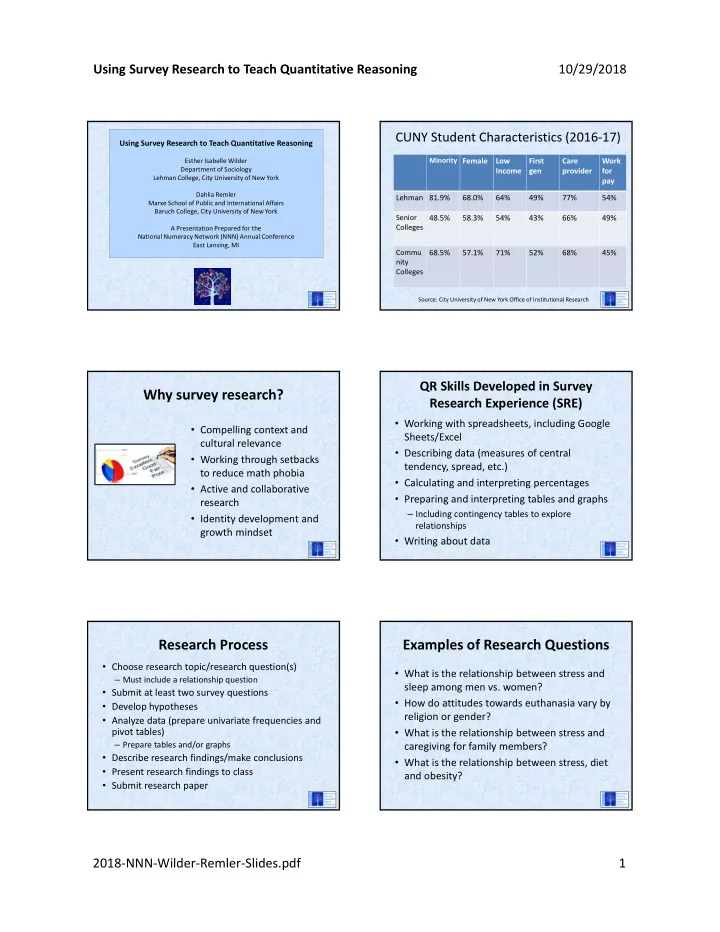
CUNY Student Characteristics (2016‐17)

Minority Female

Low Income First gen Care provider Work for pay Lehman 81.9% 68.0% 64% 49% 77% 54% Senior Colleges 48.5% 58.3% 54% 43% 66% 49% Commu nity Colleges 68.5% 57.1% 71% 52% 68% 45%

Source: City University of New York Office of Institutional Research

Why survey research?

  • Compelling context and

cultural relevance

  • Working through setbacks

to reduce math phobia

  • Active and collaborative

research

  • Identity development and

growth mindset

QR Skills Developed in Survey Research Experience (SRE)

  • Working with spreadsheets, including Google

Sheets/Excel

  • Describing data (measures of central

tendency, spread, etc.)

  • Calculating and interpreting percentages
  • Preparing and interpreting tables and graphs

– Including contingency tables to explore relationships

  • Writing about data

Research Process

  • Choose research topic/research question(s)

– Must include a relationship question

  • Submit at least two survey questions
  • Develop hypotheses
  • Analyze data (prepare univariate frequencies and

pivot tables)

– Prepare tables and/or graphs

  • Describe research findings/make conclusions
  • Present research findings to class
  • Submit research paper

Examples of Research Questions

  • What is the relationship between stress and

sleep among men vs. women?

  • How do attitudes towards euthanasia vary by

religion or gender?

  • What is the relationship between stress and

caregiving for family members?

  • What is the relationship between stress, diet

and obesity?

slide-2
SLIDE 2

Using Survey Research to Teach Quantitative Reasoning 10/29/2018 2018‐NNN‐Wilder‐Remler‐Slides.pdf 2

Creating a Class Survey

  • Students’ questions are merged together to

create a class survey

  • Fall 2018 survey:

https://goo.gl/forms/dEtcLYgzGuAEZshx1

  • Each student is required to administer the survey

to and/or obtain at least 6 respondents

– Students email friends, post on social media, etc.

  • Representative sample of well‐defined population

not practical

– But social media surveys widespread now – Teach students to think about representativeness issue

slide-3
SLIDE 3

Using Survey Research to Teach Quantitative Reasoning 10/29/2018 2018‐NNN‐Wilder‐Remler‐Slides.pdf 3 Student Feedback on Survey Research Experience (SRE)

Fall 2016 Anonymous Survey (n=22)

  • 100% agreed strongly or somewhat that they

had “learned valuable skills undertaking survey research” and that “engaging in survey research [had made them] more interested in doing research.”

  • 91% agreed strongly or somewhat that they

had become more comfortable working with data and engaging in data analysis. Students’ Voices (Focus Group): Positive Aspects

  • f the Survey Research Experience (SRE)
  • “I like the fact that we were able to pick our own

topic.”

  • “When I get older and get my degree I want to

help teach children with autism. . . . So I wanted to know for myself, my question was does having a child with a disability cause relationship stress?”

  • “Like my research question, finding out the

results, it made me more aware of how people really feel about having an immediate family member with a disability.”

Students’ Voices (Focus Group): Attitudinal Change and Skills Acquired as a Result of the Survey Research Experience (SRE)

  • “Excel.”
  • “I didn’t even know what a pivot table was. . . I thought I

knew Excel because I took a class in accounting but I had no idea anything about pivot tables.”

  • “I had no idea that surveys can be created that way. It

gives you expertise.”

  • “I feel I am a little more confident concerning discussing

data and being able to analyze it when I was in the

  • beginning. I look at it a little deeper and feel more

confident.”

  • “I think converting the numbers to percent made me feel

high class [other students laugh]. It made it so legit like wow I am a doctor. I don’t know that was fun for me.”

Challenges of Survey Research Experience

  • Developing and designing appropriate

research questions.

  • Challenge of sufficient time (to administer

survey and analyze data).

  • Creating the tables and interpreting the data

– Converting raw data to percentages

  • It was common for students to mix rows and columns

when preparing tables and reach inaccurate conclusions.

slide-4
SLIDE 4

Using Survey Research to Teach Quantitative Reasoning 10/29/2018 2018‐NNN‐Wilder‐Remler‐Slides.pdf 4 Concluding Thoughts The Survey Research Experience (SRE)

  • Survey research is an excellent tool for engaging

students in QR!

– Students especially liked that they were analyzing data that was personally meaningful and relevant to their lives.

  • implementing a SRE requires careful planning and

advance preparation on the part of the instructor – Do more with less rather than less with more

– The goal is not to train students as survey researchers but to use survey research as a tool for teaching fundamental QR skills (e.g., percentages, tables, etc.). Support for our efforts to improve students’ Quantitative Reasoning (QR) skills at CUNY have been provided by the National Science Foundation's (NSF) Division of Undergraduate Education (DUE). In particular, NSF’s Transforming Undergraduate Education in Science, Technology, Engineering and Mathematics (STEM) (TUES) award #1121844 and NSF’s Improving Undergraduate Education in STEM (IUSE) awards #1644975, #1644948, and #1832507 have been key to our efforts. We gratefully acknowledge the support of NSF. Any opinions, findings, and conclusions or recommendations expressed in this presentation are those of the authors and do not necessarily represent the views of the National Science Foundation.

How not to teach survey research

slide-5
SLIDE 5

Using Survey Research to Teach Quantitative Reasoning

Esther Isabelle Wilder Department of Sociology Lehman College, City University of New York Dahlia Remler Marxe School of Public and International Affairs Baruch College, City University of New York A Presentation Prepared for the National Numeracy Network (NNN) Annual Conference East Lansing, MI

slide-6
SLIDE 6

CUNY Student Characteristics (2016-17)

Minority Female

Low Income First gen Care provider Work for pay Lehman 81.9% 68.0% 64% 49% 77% 54%

Senior Colleges

48.5% 58.3% 54% 43% 66% 49%

Commu nity Colleges

68.5% 57.1% 71% 52% 68% 45%

Source: City University of New York Office of Institutional Research

slide-7
SLIDE 7

Why survey research?

  • Compelling context and

cultural relevance

  • Working through setbacks

to reduce math phobia

  • Active and collaborative

research

  • Identity development and

growth mindset

slide-8
SLIDE 8

QR Skills Developed in Survey Research Experience (SRE)

  • Working with spreadsheets, including Google

Sheets/Excel

  • Describing data (measures of central

tendency, spread, etc.)

  • Calculating and interpreting percentages
  • Preparing and interpreting tables and graphs

– Including contingency tables to explore relationships

  • Writing about data
slide-9
SLIDE 9

Research Process

  • Choose research topic/research question(s)

– Must include a relationship question

  • Submit at least two survey questions
  • Develop hypotheses
  • Analyze data (prepare univariate frequencies and

pivot tables)

– Prepare tables and/or graphs

  • Describe research findings/make conclusions
  • Present research findings to class
  • Submit research paper
slide-10
SLIDE 10

Examples of Research Questions

  • What is the relationship between stress and

sleep among men vs. women?

  • How do attitudes towards euthanasia vary by

religion or gender?

  • What is the relationship between stress and

caregiving for family members?

  • What is the relationship between stress, diet

and obesity?

slide-11
SLIDE 11

Creating a Class Survey

  • Students’ questions are merged together to

create a class survey

  • Fall 2018 survey:

https://goo.gl/forms/dEtcLYgzGuAEZshx1

  • Each student is required to administer the survey

to and/or obtain at least 6 respondents

– Students email friends, post on social media, etc.

  • Representative sample of well-defined population

not practical

– But social media surveys widespread now – Teach students to think about representativeness issue

slide-12
SLIDE 12
slide-13
SLIDE 13
slide-14
SLIDE 14
slide-15
SLIDE 15
slide-16
SLIDE 16
slide-17
SLIDE 17
slide-18
SLIDE 18
slide-19
SLIDE 19

Student Feedback on Survey Research Experience (SRE)

Fall 2016 Anonymous Survey (n=22)

  • 100% agreed strongly or somewhat that they

had “learned valuable skills undertaking survey research” and that “engaging in survey research [had made them] more interested in doing research.”

  • 91% agreed strongly or somewhat that they

had become more comfortable working with data and engaging in data analysis.

slide-20
SLIDE 20

Students’ Voices (Focus Group): Positive Aspects

  • f the Survey Research Experience (SRE)
  • “I like the fact that we were able to pick our own

topic.”

  • “When I get older and get my degree I want to

help teach children with autism. . . . So I wanted to know for myself, my question was does having a child with a disability cause relationship stress?”

  • “Like my research question, finding out the

results, it made me more aware of how people really feel about having an immediate family member with a disability.”

slide-21
SLIDE 21

Students’ Voices (Focus Group): Attitudinal Change and Skills Acquired as a Result of the Survey Research Experience (SRE)

  • “Excel.”
  • “I didn’t even know what a pivot table was. . . I thought I

knew Excel because I took a class in accounting but I had no idea anything about pivot tables.”

  • “I had no idea that surveys can be created that way. It

gives you expertise.”

  • “I feel I am a little more confident concerning discussing

data and being able to analyze it when I was in the

  • beginning. I look at it a little deeper and feel more

confident.”

  • “I think converting the numbers to percent made me feel

high class [other students laugh]. It made it so legit like wow I am a doctor. I don’t know that was fun for me.”

slide-22
SLIDE 22

Challenges of Survey Research Experience

  • Developing and designing appropriate

research questions.

  • Challenge of sufficient time (to administer

survey and analyze data).

  • Creating the tables and interpreting the data

– Converting raw data to percentages

  • It was common for students to mix rows and columns

when preparing tables and reach inaccurate conclusions.

slide-23
SLIDE 23

Concluding Thoughts The Survey Research Experience (SRE)

  • Survey research is an excellent tool for engaging

students in QR!

– Students especially liked that they were analyzing data that was personally meaningful and relevant to their lives.

  • implementing a SRE requires careful planning and

advance preparation on the part of the instructor – Do more with less rather than less with more

– The goal is not to train students as survey researchers but to use survey research as a tool for teaching fundamental QR skills (e.g., percentages, tables, etc.).

slide-24
SLIDE 24

Support for our efforts to improve students’ Quantitative Reasoning (QR) skills at CUNY have been provided by the National Science Foundation's (NSF) Division of Undergraduate Education (DUE). In particular, NSF’s Transforming Undergraduate Education in Science, Technology, Engineering and Mathematics (STEM) (TUES) award #1121844 and NSF’s Improving Undergraduate Education in STEM (IUSE) awards #1644975, #1644948, and #1832507 have been key to our efforts. We gratefully acknowledge the support of NSF. Any opinions, findings, and conclusions or recommendations expressed in this presentation are those of the authors and do not necessarily represent the views of the National Science Foundation.

slide-25
SLIDE 25

How not to teach survey research