
SLIDE 1
8/20/08 1
Computer System Architecture Memory Part I
Chalermek Intanagonwiwat
Slides courtesy of David Patterson
Technology Trends
Capacity Speed (latency) Logic: 2x in 3 years 2x in 3 years DRAM: 4x in 3 years 2x in 10 years Disk: 4x in 3 years 2x in 10 years
DRAM Year Size Cycle Time 1980 64 Kb 250 ns 1983 256 Kb 220 ns 1986 1 Mb 190 ns 1989 4 Mb 165 ns 1992 16 Mb 145 ns 1995 64 Mb 120 ns
1000:1! 2:1!
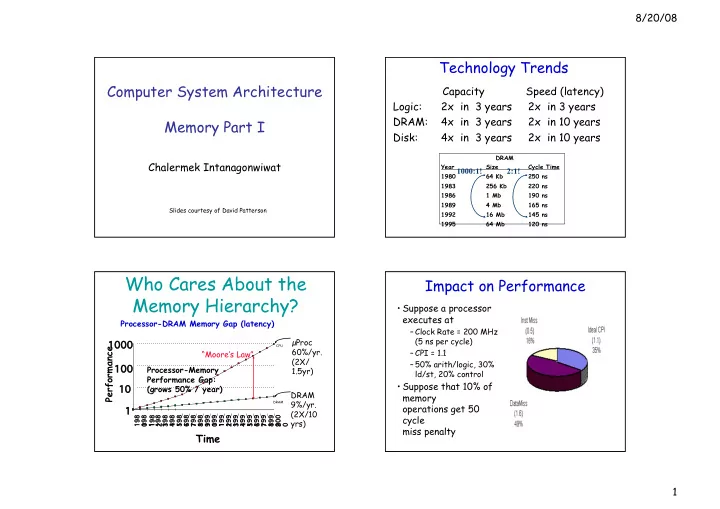
Who Cares About the Memory Hierarchy?
µProc 60%/yr. (2X/ 1.5yr) DRAM 9%/yr. (2X/10 yrs)
1 10 10 100 100 1000 1000
198 198 198 198 1 198 198 3 198 198 4 198 198 5 198 198 6 198 198 7 198 198 8 198 198 9 199 199 199 199 1 199 199 2 199 199 3 199 199 4 199 199 5 199 199 6 199 199 7 199 199 8 199 199 9 200 200
DRAM CPU
198 198 2
Processor-Memory Performance Gap: (grows 50% / year)
Performance
Time
“Moore’s Law” Processor-DRAM Memory Gap (latency)
Impact on Performance
- Suppose a processor
executes at
– Clock Rate = 200 MHz (5 ns per cycle) – CPI = 1.1 – 50% arith/logic, 30% ld/st, 20% control
- Suppose that 10% of
memory
- perations get 50