
SLIDE 1
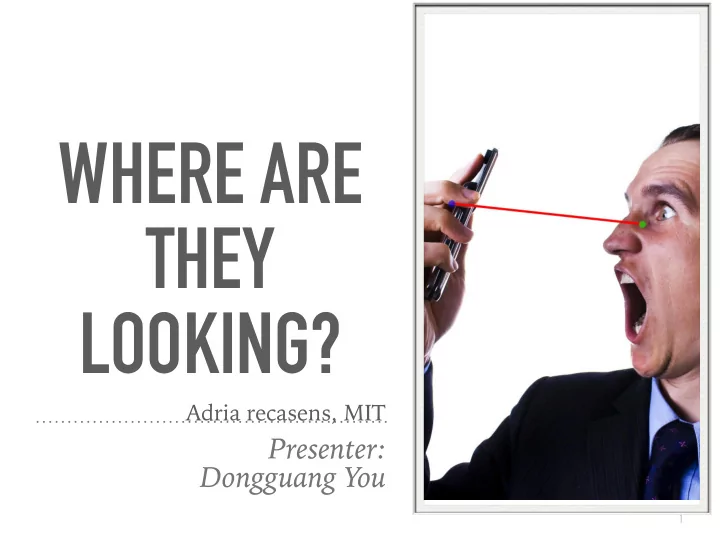
WHERE ARE THEY LOOKING?
Adria recasens, MIT
Presenter: Dongguang You
1
WHERE ARE THEY LOOKING? Adria recasens, MIT Presenter: Dongguang - - PowerPoint PPT Presentation
WHERE ARE THEY LOOKING? Adria recasens, MIT Presenter: Dongguang You 1 RELATED WORK The Secrets of Salient Object Segmentation free-view saliency for gaze saliency, people may need to gaze on objects that are not visually salient to
Adria recasens, MIT
Presenter: Dongguang You
1
RELATED WORK
➤ The Secrets of Salient Object Segmentation ➤ free-view saliency ➤ Learning to Predict Gaze in Egocentric Video ➤ gaze saliency (gaze following)
2
for gaze saliency, people may need to gaze on objects that are not visually salient to perform a task THIRD PERSON VIEWPOINT
3
difference?
This illustrates how free-view saliency differs from gaze saliency. Not only it doesn’t consider gaze direction, but also it highlights some wrong objects, such as mouse with red light in the lower right image. People performing task in the picture may focus on objects that are not salient by free view PROBLEM DEFINITION
➤ Predicting gaze saliency from a 3rd person viewpont ➤ Where are they looking at? ➤ Assumptions: ➤ 2-D head positions are given ➤ people are looking at objects inside the image
4
APPLICATIONS
➤ Behavior understanding
5
APPLICATIONS
➤ Behavior understanding ➤ Social situation understanding ➤ do people know each other?
6
APPLICATIONS
➤ Behavior understanding ➤ Social situation understanding ➤ do people know each other? ➤ are people collaborating on the same task?
7
DIFFICULTY
8
CONTRIBUTION OF THIS WORK
➤ Solve gaze following in 3rd person view, instead of ego-centric ➤ Predict exact gaze location rather than just direction ➤ Do not require 3D location info of people in the scene
9
DATASET
1,548 from SUN
10
33,790 from MS COCO 1,548 from SUN 9,135 from Action 40 7,791 from Pascal 508 from Imagenet 198,097 from Places
gaze annotation
GazeFollow dataset: 130,339 people in 122,143 images training: rest testing: 4,782 people
9 more annotations per person in the scene
TEST DATA EXAMPLES & STATS
11
APPROACH
How do human predict where a person in a picture is looking at?
12
human first estimate the possible gaze directions based on head pose, then find the most salient objects in those directions
APPROACH
13
Saliency Map Gaze direction map(Gaze mask) gaze prediction
MODEL
14
INPUT
15
image patch cropped around head head location full image
How does it force Saliency Pathway and Gaze Pathway to learn the saliency map and gaze mask respectively?
SALIENCY PATHWAY
16
captures the salient regions in the image. Output size:13 x 13
SALIENCY PATHWAY
17
Initialized from an Alexnet trained on Places dataset. Output size: 13 x 13 x 256
Each 13 x 13 feature map captures different
SALIENCY PATHWAY
18
One feature map of filter size = 1 x 1 x 256 Weighted sum of 256 feature maps
GAZE PATHWAY
19
captures the possible gaze directions
GAZE PATHWAY
20
Initialized from an Alexnet trained on Imagenet.
GAZE PATHWAY
21
Sigmoid transformation Output size: 13 x 13 Combine the saliency map with the gaze mask
MULTIMODAL PREDICTION WITH SHIFTED GRIDS
22
They treated it as a multimodal classification problem instead of regression problem, because there are ambiguities in gaze location, and regression would just take the middle The softmax loss penalizes all wrong grids uniformly, but we want it to penalize less on grids closer to the answer, so we compute loss on all shifted grids and take an average. In their model they used shifted grids with size 5 x 5 QUANTITATIVE RESULT
23
Recall that there are ten ground-truth gaze for each person in test images AUC: rank the grid by their softmax prob and draw the ROC curve Dist: distance to the average ground- truth Min Dist: distance to closest ground- truth Ang: angular distance between prediction and average ground-truth Center: The prediction is always the center of the image. Fixed bias: The prediction is given by the average of fixations from the training set for heads in similar locations as the test image. Judd[11]: We use a state-of-the-art free-viewing saliency model [11] as a predictor of gaze Comparisons: SVM BASELINE
24
concatenate SVM
QUANTITATIVE RESULT
25
Comparisons: ABLATION STUDY
26
QUALITATIVE RESULT1
27
The model is able to find both reasonable gaze directions as well as salient objects on those directions This proves that gaze mask is useful because the model is able to predict different gaze location for different people in the same picture The first picture in the second row: QUALITATIVE RESULT2
28
RECALL THAT:
29
Weighted sum of 256 feature maps. Each feature map captures some object patterns. Weights are learned such that objects people usually look at have higher(positive) weights.
QUALITATIVE RESULT3
➤ Top activation image regions for 8 conv5 neurons in Saliency
pathway
30
EVALUATION
Strength:
➤ Combine gaze direction and visual saliency ➤ Good performance ➤ Use head position instead of face position ➤ can handle the case where only the back is seen
Weakness:
➤ Ignoring depth -> unreasonable prediction ➤ Cross-entropy loss VS shifted grids?
31
DEMO
➤ http://gazefollow.csail.mit.edu/demo.html ➤ Photo with people appearing in their back ➤ http://jessgibbsphotography.com/wp-content/uploads/
2013/01/ crowds_of_people_take_photos_of_flag_ceremony_outside_ town_hall.jpg
➤ Photo where people are staring at objects outside the image ➤ http://www.celwalls.com/wallpapers/large/7525.jpg
32