what is a cauti
play

What is a CAUTI? Questionable Validity of the Catheter-Associated - PDF document

11/12/2015 What is a CAUTI? Questionable Validity of the Catheter-Associated Urinary Tract Infection (CAUTI) Metric Catheter-Associated Urinary Tract Infection for Value-based Purchasing Projected to occur in 290,000 US Hospital


  1. 11/12/2015 What is a CAUTI? Questionable Validity of the Catheter-Associated Urinary Tract Infection (CAUTI) Metric  Catheter-Associated Urinary Tract Infection for Value-based Purchasing  Projected to occur in 290,000 US Hospital patients annually, costing $290 million 1  Prevention of CAUTI centers around sterile catheter By Mara Rice-Stubbs RN, BSN insertion, proper catheter maintenance, and decreasing catheter usage.  Indications for an Indwelling Importance of the CAUTI Metric in Value-Based Purchasing Catheter Appropriate use of the Indwelling Catheter  Hospitals performing in lowest quartile for HAC reduction Need for accurate measurement of urinary output in critically ill patients are penalized 1% of the entire Medicare fee reimbursement Acute urinary retention or bladder outlet obstruction in an all-or-none fashion (totaling $373 million across 721 Perioperative use for selected surgical procedures or institutions) 8 anticipated to receive large-volume infusions or diuretics during surgery  1/3 of Centers for Medicare and Medicaid Services HAC Intraoperative monitoring of urinary output reduction penalty based on the CDC CAUTI metric To assist in healing of open sacral or perineal wounds in incontinent patients analysis 2 Patients requiring prolonged immobilization, such as an unstable thoracic or lumbar spine or multiple traumatic  Financial repercussions drive hospital behavior injuries such as a pelvic fracture To improve comfort for end of life care if needed http://www.cdc.gov/hicpac/cauti/02_cauti2009_abbrev.html
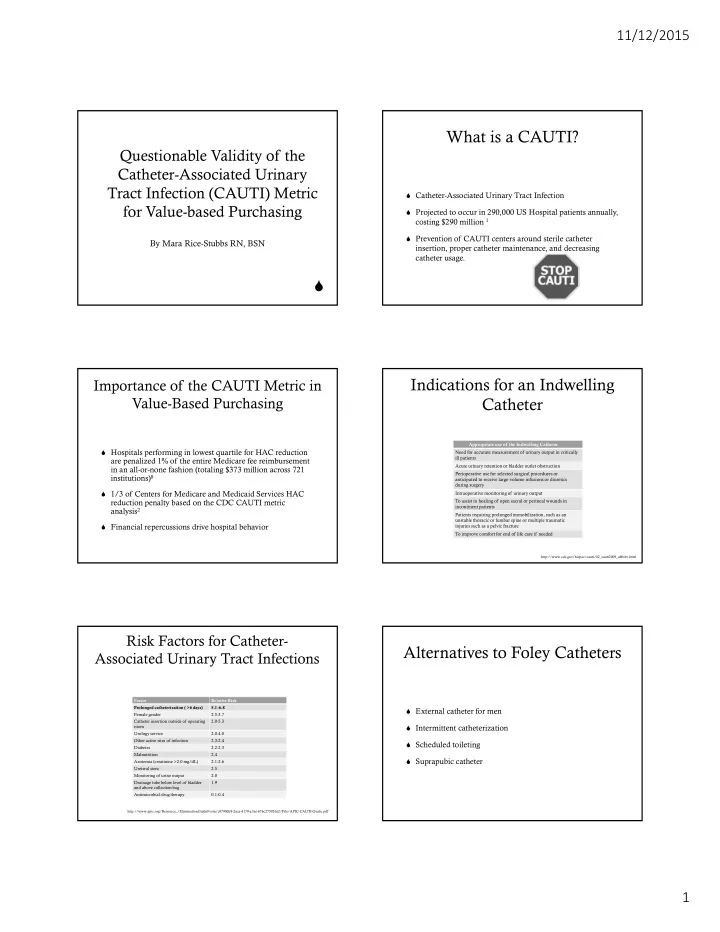
 Risk Factors for Catheter- Alternatives to Foley Catheters Associated Urinary Tract Infections Factor Relative Risk Prolonged catheterization ( >6 days) 5.1-6.8  External catheter for men Female gender 2.5-3.7 Catheter insertion outside of operating 2.0-5.3  Intermittent catheterization room Urology service 2.0-4.0 Other active sites of infection 2.3-2.4  Scheduled toileting Diabetes 2.2-2.3 Malnutrition 2.4  Suprapubic catheter Azotemia (creatinine >2.0 mg/dL) 2.1-2.6 Ureteral stent 2.5 Monitoring of urine output 2.0 Drainage tube below level of bladder 1.9 and above collection bag Antimicrobial-drug therapy 0.1-0.4 http://www.apic.org/Resource_/EliminationGuideForm/c0790db8-2aca-4179-a7ae-676c27592de2/File/APIC-CAUTI-Guide.pdf 1

  2. 11/12/2015 Interventions to Reduce Decreasing Catheter Usage CAUTIs Hinges on Adequate Staffing  Improved catheter maintenance- Castile soap/Theraworx spray utilized to clean the catheter and decrease the biofilm.  Foley Care Bundle: Ensuring the foley bag never touches the floor, the tubing remains kink-free, foley securement devices, maintaining a closed system, and documenting the reason for foley necessity every shift.  Nurse-Driven Catheter Removal Protocols- algorithm allowing nurses to be proactive at removing a catheter without an MD order  CAUTI Huddles to identify trends and gaps  Daily Rounds on Catheter Necessity Allnurses.com National Increase in CAUTI Rates: Center for Disease Control National Healthcare Safety Network How is this possible? CAUTI Metric  Current metric Data and Dates of Acquisition 2009 2010 2011 2012 2013 Metric  Self-reported data Centers for Disease Control and Prevention NHSN (Data.Medicare.Gov)  # Urinary Infections ÷ # Catheter Days ÷ (1,000 converted to a Standardized 1.00 0.99 1.03 Standardized Infection Ratio) Infection Ratio Number of Facilities ~1,749 2,293 2,277  Measures catheter maintenance Centers for Disease Control and Prevention NHSN (HAI Progress Reports) Standardized 1.00 1.03 1.06 Infection Ratio Number of Facilities ~1,749 3,597 2,781 AHRQ CAUTI Metric Agency for Healthcare Research & Quality CAUTI Metric Comparison  Data obtained from 18,000-33,000 randomly selected medical records from patients with the subset of diagnoses Data and Dates of Acquisition for myocardial infarction, heart failure, pneumonia, and 2009 2010 2011 2012 2013 Metric major surgical patients. Agency for Healthcare Quality and Research (AHRQ)  # Urinary Infections ÷ 1,000 Hospital Discharges Infections/1,000 12.25 11.30 10.58 8.8 Discharges  Metric combines catheter usage and catheter care Baseline Ratio 1.00 0.92 0.86 0.72 Number of Charts ~18,000-33,000 medical records from 800 hospitals A statistically significant 28.2% decrease in the CAUTI rate between 2010-2013 (p<.011) 2

  3. 11/12/2015 Concerns about the CDC Concerns about the CDC Metric Metric  CDC Metric= 3-6% increase in CAUTI rate  1. May inadvertently inflate the CAUTI rate when unnecessary foley catheters are removed.  AHRQ= 28.2% decrease in CAUTI rate during the same time period  2. The data used for this metric is self-reported from  Removing unnecessary foley catheters may inadvertently increase the hospitals. Standardized Infection Ratio  # Infections/# Catheter Days  3. In failing to account for catheter removal, hospitals are  Catheters remain in most critically ill patients with an increased risk not incentivized to provide adequate staffing. of infection Both the numerator and denominator decrease, but the denominator  decreases more than the numerator, resulting in an increase in the SIR. Concerns about the CDC Concerns about the CDC Metric Continued Metric Continued  Data is self-reported from hospitals and not independently  Does not reward hospitals for removing unnecessary foley verified catheters  CDC reports that only 20 of the 50 states check the CDC  May actually penalize the hospital for proactive efforts to NHSN CAUTI data for quality and completeness decrease catheter usage  Does not promote adequate staffing ratios Limitations of this Analysis Recommendations  AHRQ metric not risk-adjusted for CAUTI rates  CAUTI Metric should incorporate BOTH catheter usage and catheter care.  May not have the same validity in making comparisons between facilities caring for patients with different levels of  APIC indicates Catheter Usage> Catheter Care acuity.  The current metric fails to accurately differentiate between  The data sets were comparing two slightly different, but good and poor performers. largely overlapping patient populations 3

Download Presentation
Download Policy: The content available on the website is offered to you 'AS IS' for your personal information and use only. It cannot be commercialized, licensed, or distributed on other websites without prior consent from the author. To download a presentation, simply click this link. If you encounter any difficulties during the download process, it's possible that the publisher has removed the file from their server.

Recommend


More recommend