Wh Where Ou Our Chil ildren Go o aft fter Hig igh School: l: - - PowerPoint PPT Presentation

wh where ou our chil ildren go o aft fter hig igh school l
SMART_READER_LITE
LIVE PREVIEW

Wh Where Ou Our Chil ildren Go o aft fter Hig igh School: l: - - PowerPoint PPT Presentation

Wh Where Ou Our Chil ildren Go o aft fter Hig igh School: l: A Longitudinal Study of College & Work Outcomes of San Antonio-Area High School Graduates, Mi Michae ael Vi Villar arreal al 2005 to 2014 Ph.D. Candidate Ray Marshall


slide-1
SLIDE 1

Wh Where Ou Our Chil ildren Go

  • aft

fter Hig igh School: l:

A Longitudinal Study of College & Work Outcomes

  • f San Antonio-Area High School Graduates,

2005 to 2014 Presentation, Aug 31, 2017

Mi Michae ael Vi Villar arreal al Ph.D. Candidate Ray Marshall Center University of Texas, Austin

1

slide-2
SLIDE 2

Qu Questio ions t to b be a answered f for Be Bexar C County s students a and h hig igh s schools:

1. Does more education beyond a high school diploma payoff? 2. What are the college access and completion rates of our high school graduates? 3. Do college graduation rates vary by college? 4. To what extent does poverty affect university access and completion rates? 5. Which high schools do better than expected given their concentration of student poverty? 6. Why don’t more college-aspiring students apply to and enroll in universities? 7. What is the history of postsecondary student outcomes by high school?

2

University outcomes in this report only reflect Texas public and private universities. Next year’s update will include National Clearing House data that will account for universities outside of Texas.

slide-3
SLIDE 3
  • 1. Does more education beyond a

high school diploma payoff?

3

slide-4
SLIDE 4

Quarterly Ea Earnings per Highest Degree Ea Earned for 45 quarters after High Sc School l Grad aduati ation, HS S Grad ad Co Cohorts ts 2005 2005-2014 2014

2000 4000 6000 8000 10000 12000 14000 16000 18000 1 5 9 13 17 21 25 29 33 37 41 45 HS Cert AA BA 2000 4000 6000 8000 10000 12000 14000 16000 18000 1 5 9 13 17 21 25 29 33 37 41 45 HS Cert AA BA

Males Females

A bachelor’s degree pays over the long-term. Women at all education levels earn less than men, but earning a postsecondary education makes more of a difference in earnings for women.

slide-5
SLIDE 5

Annual Cost of College and Financial Aid Provided to Full-time College Students, 2015 Public Universities Private Universities SA Private Universities Community Colleges Total Cost 20,358 $ 35,949 $ 48,590 $ 12,339 $ Grant Aid 4,994 $ 13,213 $ 22,534 $ 8,107 $ Percent that received grant aid 75% 92% 90% 68% Student Loans 5,566 $ 7,703 $ 9,288 $ 4,352 $ Percent that received a loan 45% 66% 53% 20% Unmet financial need of those with grant aid * 12,851 $ 17,614 $ 21,111 $ 3,343 $ Unmet financial need of those w/o grant aid * 17,846 $ 30,828 $ 43,644 $ 11,450 $

* Includes average student loan proceeds across all students

An Annua ual Cost of College ge & Financial Ai Aid Awarded to to Full-ti time e Stu Studen dents, ts, 2015

The average student has unmet financial need even if they receive grant and loan aid. If the student or his/her parents lack the funds to cover the remaining costs, the student will likely work during summers and the school year. In a survey of students who left college without a degree, the number one reason they gave for dropping out was having an unmet financial need. Sixty percent of students who did not graduate reported that combining work and school in their first year in college was "too stressful" (J. Johnson & Rochkind, 2016).

slide-6
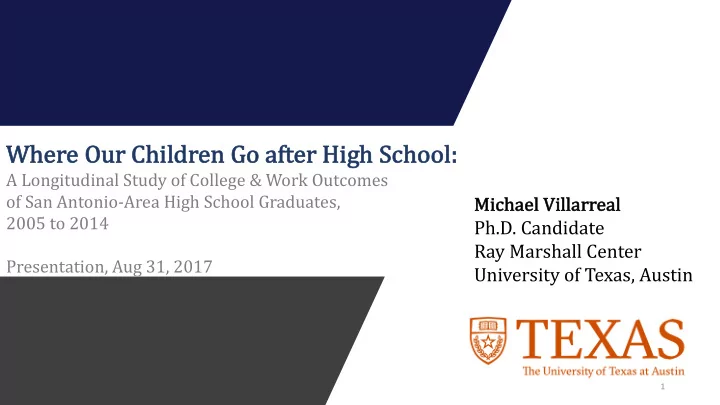
SLIDE 6

Associate only HS Diploma only Bachelor's only Certificate only Male $121,927 $137,944 $148,328 $187,113 Female $109,746 $106,074 $118,425 $140,821 $0 $20,000 $40,000 $60,000 $80,000 $100,000 $120,000 $140,000 $160,000 $180,000 $200,000

Net Present Value of Benefits and Costs of Postsecondary Education, First 12 Years After HS Graduation

§ On average earning a bachelor’s degree causes earnings over a life time to exceed those that only earn a

  • certificate. However, as we see in the

figure to the right, the payoff within the first 12 years after high school is significantly greater for those that earn a certificate. § The payoff to certificate earners is likely underestimated here because this earnings data does not include earnings from being self-employed. § If most college students will need to work to afford college, acquiring technical training through CTE and a rigorous academic education through dual credit may produce the largest impact on helping student achieve their postsecondary goals.

Net Present Value of Postsecondary Education in 12 Years After HS Graduation

6

slide-7
SLIDE 7
  • 2. What are the college access &

completion rates of our high school graduates?

7

slide-8
SLIDE 8
  • Avg. Rates of College Access & Completion, HS Grads 2005-14

Texas has set a goal to raise the percent of 25- to 34-years-olds with a certificate or degree from 41 percent in 2015 to 60 percent by 2030. To achieve this goal, 100 percent of high school graduates must enroll in a postsecondary program and 70 percent must complete.

Texas Bexar ECISD EISD NISD NEISD SAISD SWISD 42% 45% 47% 55% 39% 39% 52% 51% CC Enrollment in Year after HS 30% 30% 32% 31% 32% 26% 32% 37% AA 6-Yr grad rate 16% 13% 14% 13% 17% 10% 10% 17% Univ transfer 6-year rate 21% 23% 25% 12% 28% 30% 15% 17% BA 6-Yr grad rate of 16% 13% 16% 4% 17% 18% 5% 10% Univ Enrollment in Year after HS

1

28% 25% 21% 14% 28% 34% 17% 12% Application rate 39% 36% 28% 27% 38% 46% 32% 18% Admission rate 91% 91% 92% 89% 92% 91% 88% 94% Summer melt rate

2

10% 10% 8% 11% 9% 10% 12% 7% BA 6-Yr grad rate 62% 61% 60% 42% 63% 65% 42% 55%

Note: Six year outcomes are based on high school cohorts from 2005 to 2009. All other outcomes are based on cohorts 2005 to 2014.

  • 1. University outcomes only reflect Texas public and private universities.
  • 2. Summermelt applies to students who were admitted to a Texas university but did not enroll in the year following high school.

No College in Year after HS

slide-9
SLIDE 9
  • 3. Do college graduation rates vary

by college?

9

slide-10
SLIDE 10

10

0% 10% 20% 30% 40% 50% 60% 70% 80% 90% 100% TEXAS SOUTHERN UNIVERSITY TEXAS A&M UNIV-KINGSVILLE UT, PAN AMERICAN UT, PERMIAN BASIN SUL ROSS STATE UNIVERSITY OUR LADY OF THE LAKE UNIV ANGELO STATE UNIVERSITY WEST TEXAS A&M UNIVERSITY UT, SAN ANTONIO TEXAS A&M UNIV-CORPUS CHRISTI UT, EL PASO TEXAS A&M INTERNATIONAL UNIV LAMAR UNIVERSITY PRAIRIE VIEW A&M UNIVERSITY UNIVERSITY OF HOUSTON TEXAS A&M UNIVERSITY-COMMERCE UNIV OF THE INCARNATE WORD UT, ARLINGTON UNIVERSITY OF NORTH TEXAS TEXAS STATE UNIV - SAN MARCOS TEXAS A&M UNIV AT GALVESTON

  • ST. MARY'S UNIVERSITY

SAM HOUSTON STATE UNIVERSITY UT, TYLER STEPHEN F. AUSTIN STATE UNIV TEXAS TECH UNIVERSITY UT, DALLAS UT, AUSTIN TEXAS A&M UNIVERSITY TRINITY UNIVERSITY

Bachelor's Degree 6-Yr Grad Rates, Bexar County HS Grads 2005-09

Bachelor’s Degree 6-Yr Grad Rates, Bexar HS Grads 2005-09

§ One-third of Bexar high school grads enroll at UTSA. UTSA’s six- year graduation rate is 45%. § Texas State is slightly more selective than UTSA but has a 6- year graduation rate of 63%. Texas State graduates 40 percent more of its students than UTSA. § Private colleges and universities

  • n average have higher

graduation rates. In San Antonio, Trinity, St. Mary’s, UIW, and OLLU have grad rates of 100, 64, 60, and 42 percent.

slide-11
SLIDE 11
  • 4. To what extent does poverty affect

university access and completion rates?

  • 5. Which high schools do better than

expected given their concentration

  • f student poverty?

11

slide-12
SLIDE 12

12

The following section highlights the relationship between a school’s level of student poverty and its students’ record of university access and bachelor’s degree completion. Each page includes two scatter plots. The first titled “All Students” plots the of postsecondary outcomes of all students of a school and the school’s level of student poverty. The second titled “Economically Disadvantaged” plots the postsecondary outcomes of a school’s economically disadvantaged graduates only and the school’s level of student poverty. Three major patters emerge: 1. Poverty negatively affects a high school’s share of graduates who pursue and complete a bachelor’s degree, as displayed in the graphs titled “All Students”. As the percent of economically disadvantaged students increases, a high school’s share of graduates applying to, enrolling in and graduating from a bachelor’s degree program declines. 2. Educating economically disadvantaged students is a challenge for all schools. As shown in the graphs titled “Economically Disadvantaged Students”, the performance gap between schools of low and high poverty shrinks significantly when only considering the postsecondary outcomes of low-income students. However, on average, low-income students at wealthier schools apply to, enroll in, and graduate from bachelor degree programs at higher rates than low-income students at schools with higher concentrations of student poverty. 3. There are ten local examples of schools that break the negative relationship between school poverty and college achievement. These schools have high rates of student poverty and high rates of university application and

  • enrollment. However, they have yet to

demonstrate high rates of degree completion. Moreover, all of these schools are open enrollment, which raises questions about the extent to which the “creaming” of students is the cause of their higher rates of college access.

slide-13
SLIDE 13

Un

  • Univ. Ap

Application Rates per HS & 95% 95% CI Predict cted Rate, 2014 2014 Cla lass

ISA HEALTH CAREERS H S JUDSON EARLY COLLEGE ACADEMY SCHOOL OF SCIENCE AND TECHNOLOGY HARMONY SCIENCE HARMONY SCIENCE YWLA TRAVIS EARLY COLLEGE H S KIPP UNIVERSITY PREP H S FOX TECHNICAL H S HOUSTON H S

20 40 60 80 100% 20 40 60 80 100% Percent of Economically Disadvantaged Students of High School

HEALTH CAREERS H S HENRY FORD ACADEMY BROOKS ACADEMY OF SCIENCE AND ENG JUDSON EARLY COLLEGE ACADEMY SCHOOL OF SCIENCE AND TECHNOLOGY HARMONY SCIENCE HARMONY SCIENCE YWLA TRAVIS EARLY COLLEGE H S KIPP UNIVERSITY PREP H S SOUTHWEST H S FOX TECHNICAL H S SAN ANTONIO SCHOOL FOR INQUIRY & HOUSTON H S

20 40 60 80 100% 20 40 60 80 100% Percent of Economically Disadvantaged Students of High School

All Students Econ Disadvantaged Students

13

slide-14
SLIDE 14

En Enrollment Rates pe per r Hi High S Sch chool & & 95 95% % CI CI Pr Predicted Rate, Class Class of 2014

HEALTH CAREERS H S HENRY FORD ACADEMY JUDSON EARLY COLLEGE ACADEMY SCHOOL OF SCIENCE AND TECHNOLOGY HARMONY SCIENCE HARMONY SCIENCE YWLA TRAVIS EARLY COLLEGE H S OMEGA ACADEMIC CENTER KIPP UNIVERSITY PREP H S FOX TECHNICAL H S SAN ANTONIO SCHOOL FOR INQUIRY & EDISON H S MILTON B LEE ACADEMY OF SCIENCE &

20 40 60 80 100% 20 40 60 80 100% Percent of Economically Disadvantaged Students of High School

2014 High School Graduating Class

HEALTH CAREERS H S BROOKS ACADEMY OF SCIENCE AND ENG JUDSON EARLY COLLEGE ACADEMY SCHOOL OF SCIENCE AND TECHNOLOGY HARMONY SCIENCE HARMONY SCIENCE YWLA JUBILEE ACADEMIC CENTER TRAVIS EARLY COLLEGE H S KIPP UNIVERSITY PREP H S FOX TECHNICAL H S EDISON H S HOUSTON H S

20 40 60 80 100% 20 40 60 80 100% Percent of Economically Disadvantaged Students of High School

2014 High School Graduating Class & FRL

All Students Econ Disadvantaged Students, Only

14

slide-15
SLIDE 15

Si Six-Ye Year Ba Bachelor’s Degr gree Gr Grad Ra Rates per HS HS & & 95 95% % CI CI of

  • f Predicted Rate, Class

Class of 2009

KAREN WAGNER HIGH SCHOOL CORPUS CHRISTI ACADEMY RICK HAWKINS H S

20 40 60 80 100% 20 40 60 80 100% Percent of Economically Disadvantaged Students of High School

A L A M O H E I G H T S H S J O H N S O N H S I S A C O R P U S C H R I S T I A C A D E M Y

20 40 60 80 100% 20 40 60 80 100% Percent of Economically Disadvantaged Students of High School

All Students Econ Disadvantaged Students

15

slide-16
SLIDE 16
  • 6. Why don’t more college-aspiring

students apply to and enroll in universities?

16

slide-17
SLIDE 17

17

§ Nearly 8 out of 10 high school students aspire to continue their education beyond high school to earn a certificate or degree. § Freshmen have the highest rates of interest in earning a bachelor’s degree - 69%. § With each passing grade, interest in a bachelor’s degree declines as interest in an associate degree increases.

Postsecondary Goals by Grade at a Typical Comprehensive High School

78 77 75 83

10% 30% 50% 70% 90% Fresh Sophs Jrs Srs Postsecondary Degree/Cert

69 66 60 54

10% 30% 50% 70% 90% Fresh Sophs Jrs Srs Earn a Bachelor's

8 9.5 12 25

10% 30% 50% 70% 90% Fresh Sophs Jrs Srs Earn an Associates

1.7 2 3.6 4.4

10% 30% 50% 70% 90% Fresh Sophs Jrs Srs Earn a Certification

1.7 .78 2.5 1.5

10% 30% 50% 70% 90% Fresh Sophs Jrs Srs Work only

5.2 7.3 8.1 7.7

10% 30% 50% 70% 90% Fresh Sophs Jrs Srs Enlist in Military

8.7 7.5 7.4 4.6

10% 30% 50% 70% 90% Fresh Sophs Jrs Srs Other

6 7.2 6.9 3.5

10% 30% 50% 70% 90% Fresh Sophs Jrs Srs Not sure, I have no plans

Figure 3. Postsecondary Goals by Grade,

slide-18
SLIDE 18

18

51 28 17 1 7 7 3

20 40 60 80% Freshmen

56 27 21 1 4 6 2

20 40 60 80% Sophomores

61 50 33 2 5 7 6

20 40 60 80% Juniors

82 49 39 37 17 31 27

20 40 60 80%

Researched College Info Practiced SAT/ACT AP/ Dual-Credit Application Essay Took SAT/ACT Applied Fin Aid Applied to College

Seniors

College-Intending Students Only

§ This graph summarizes rates of completion of college prep activities by grade. § As students progress to senior year, rates should rise so that the share taking the SAT (17%) and applying is to college (27%) equals the share who said they wanted to earn a bachelor’s degree their freshman year (69%). § A maj majority ty said they did not meet with a counselor until their senior year.

College Choice Process by Key Prep Activities by Grade at a Typical Comprehensive High School

slide-19
SLIDE 19

19

§ Students at a typical comprehensive high school were given a list of colleges and universities in the US and asked to identify all the ones they plan to apply to. § As students progress to senior year, Alamo Colleges rises to the top from 9% to 46%. § This is likely due to students putting off preparing for and taking the SAT/ACT.

Top 10 Colleges of Choice by Grade at a Typical Comprehensive High School

slide-20
SLIDE 20
  • 7. What is the history of postsecondary

student outcomes by high school?

20

The following slide illustrates a sample high school dashboard provided to each member high school.

slide-21
SLIDE 21

20 40 60 80 100% 2005 2007 2009 2011 2013 Univ Application Rate 20 40 60 80 100% 2005 2007 2009 2011 2013 Univ Admit Rate 20 40 60 80 100% 2005 2007 2009 2011 2013 No Tx Univ Enrollment of Admitted 20 40 60 80 100% 2005 2007 2009 2011 2013 4-Yr BA Grad Rate 20 40 60 80 100% 2005 2007 2009 2011 2013 5-Yr BA Grad Rate 20 40 60 80 100% 2005 2007 2009 2011 2013 6-Yr BA Grad Rate 20 40 60 80 100% 2005 2007 2009 2011 2013 CC Enroll Rate in Y1 After HS 20 40 60 80 100% 2005 2007 2009 2011 2013 6-Yr Cert Grad Rate 20 40 60 80 100% 2005 2007 2009 2011 2013 6-Yr AA Grad Rate 20 40 60 80 100% 2005 2007 2009 2011 2013 6-Yr CC to Univ Transfer Rate 20 40 60 80 100% 2005 2007 2009 2011 2013 6-Yr BA Grad Rate for Transfer Students 20 40 60 80 100% 2005 2007 2009 2011 2013 No College in Y1 After HS

Brackenridge HS College Going & Graduation Rates by HS Grad Cohorts (does not include out-of-state college students) 21

slide-22
SLIDE 22

Not Notes

22

1. This study analyzed data from a state longitudinal data system at the University of Texas at Austin. This system includes student-level administrative data collected by the Texas Education Agency (TEA) and the Texas Higher Education Coordinating Board (CB). Data extracted from this data warehouse for this study describes the secondary and postsecondary education of public school students from 2005 to 2015, including student demographics and household poverty status. University outcomes only reflect Texas public and private universities. 2. Summer melt applies to students who were admitted to a Texas university but did not enroll in the year following high school. 3. Six year outcomes are based on high school graduation cohorts from 2005 to 2009. All other

  • utcomes are based on cohorts 2005 to 2014.

4. Graphs on pages 17 through 19 are based on a survey of 2,434 high school students enrolled in a comprehensive Bexar county high school.