Welcome to IFSACs webinar Please stand by we will be starting the - - PowerPoint PPT Presentation

welcome to ifsac s webinar
SMART_READER_LITE
LIVE PREVIEW

Welcome to IFSACs webinar Please stand by we will be starting the - - PowerPoint PPT Presentation

Welcome to IFSACs webinar Please stand by we will be starting the presentation soon. IFSACs Webinar Are Outbreak Illnesses Representative of Sporadic Illnesses? Agenda Friday, January 10, 2014, 2:00 3:00 pm EST Time Speaker


slide-1
SLIDE 1

Welcome to IFSAC’s webinar

Please stand by ‐ we will be starting the presentation soon.

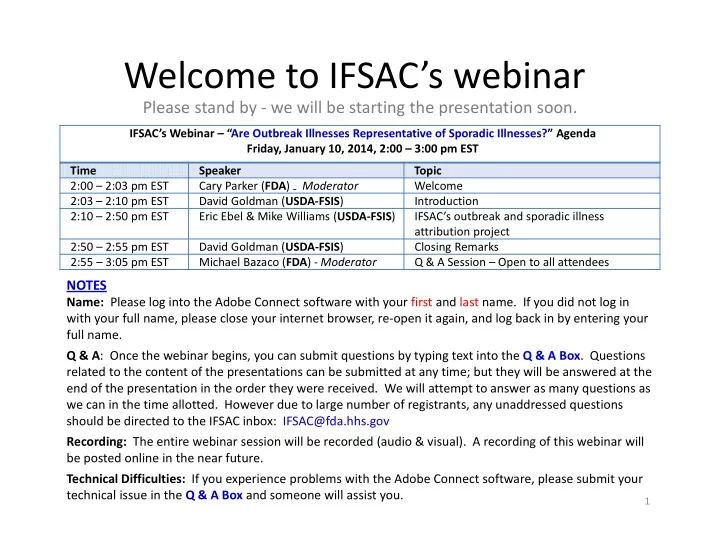
IFSAC’s Webinar – “Are Outbreak Illnesses Representative of Sporadic Illnesses?” Agenda Friday, January 10, 2014, 2:00 – 3:00 pm EST Time Speaker Topic 2:00 – 2:03 pm EST Cary Parker (FDA) ‐ Moderator Welcome 2:03 – 2:10 pm EST David Goldman (USDA‐FSIS) Introduction 2:10 – 2:50 pm EST Eric Ebel & Mike Williams (USDA‐FSIS) IFSAC’s

  • utbreak and sporadic illness

attribution project 2:50 – 2:55 pm EST David Goldman (USDA‐FSIS) Closing Remarks 2:55 – 3:05 pm EST Michael Bazaco (FDA) ‐ Moderator Q & A Session – Open to all attendees

NOTES

Name: Please log into the Adobe Connect software with your first and last name. If you did not log in with your full name, please close your internet browser, re‐open it again, and log back in by entering your full name. Q & A: Once the webinar begins, you can submit questions by typing text into the Q & A Box. Questions related to the content of the presentations can be submitted at any time; but they will be answered at the end of the presentation in the order they were received. We will attempt to answer as many questions as we can in the time allotted. However due to large number of registrants, any unaddressed questions should be directed to the IFSAC inbox: IFSAC@fda.hhs.gov Recording: The entire webinar session will be recorded (audio & visual). A recording of this webinar will be posted online in the near future. Technical Difficulties: If you experience problems with the Adobe Connect software, please submit your technical issue in the Q & A Box and someone will assist you.

1

slide-2
SLIDE 2

The Interagency Food Safety Analytics Collaboration (IFSAC): Introduction

IFSAC Webinar Presented By: David P. Goldman, MD, MPH

Assistant Administrator, Office of Public Health Science Food Safety and Inspection Service (FSIS), United States Department of Agriculture (USDA) January 10, 2014

2

slide-3
SLIDE 3

Our Approach

An interagency collaboration that:

  • Builds on a history of working together on

source attribution

  • Applies advances in source attribution methods
  • Leverages knowledge, expertise and data

among agencies

  • Builds an efficient structure guided by strategy
  • Prioritizes communications and stakeholder

input

3

slide-4
SLIDE 4

Apply Advances in Source Attribution Methods

  • Improved food categories
  • Statistical analysis of data from foodborne outbreak

surveillance

  • Hybrid analysis using outbreak surveillance data and

sporadic case‐control study data

  • The Hald Bayesian model
  • Estimates of uncertainty
  • Expanded data sources

4

slide-5
SLIDE 5

Leverage Knowledge, Expertise and Data Among Agencies

  • Shared environment to develop

methodology and conduct analyses

  • Apply data from all applicable sources
  • Shared results, interpretation and use
  • Enhanced policy decisions

5

slide-6
SLIDE 6

Build a Shared Structure and Strategy

Steering Committee

  • 2 members from each agency able to commit

resources

  • Annual rotation of chair person among agencies
  • Assess, approve and oversee IFSAC projects

Technical Workgroup

  • Designated group of agency experts and analysts
  • Understand the needs of each agency
  • Develops proposals and plans for IFSAC projects
  • Coordinates IFSAC activities within each agency

Project Teams

  • Assigned agency experts performing specific projects

6

slide-7
SLIDE 7

Communications and Stakeholder Input

Past:

  • Series of public meetings, 2010
  • Risk Communications Advisory Committee consultation,

2011

  • CDC FSMA Surveillance Work Group
  • IFSAC public meetings, 2012
  • PEW/RWJ Food Safety Forum, 2012
  • Web‐based information and communications

www.cdc.gov/foodborneburden/attribution.html

  • Webinars, June 2013: “Improving the Categories Used to

Classify Foods Implicated in Outbreaks”

  • Stakeholder updates

Upcoming:

  • New IFSAC webpage, Winter‐Spring, 2014
  • Planning Public Meeting, Fall‐Winter, 2014

7

slide-8
SLIDE 8

IFSAC Webinars

  • Low‐cost, easily accessible mode of

communication with stakeholders

  • Ability to expeditiously share project

updates and results before publication in peer review journals

  • Two webinars planned per year
  • Today: “Are Outbreak Illnesses

Representative of Sporadic Illnesses?”

8

slide-9
SLIDE 9

Are Outbreak Illnesses Representative of Sporadic Illnesses?

An update on a project of the Interagency Food Safety Analytics Collaboration (IFSAC) An IFSAC Webinar Presented By:

Eric D. Ebel, DVM, MS, DACVPM(Epi), ASA/CERA Senior Veterinary Medical Officer Food Safety and Inspection Service (FSIS), United States Department of Agriculture (USDA) Michael S. Williams, PhD Senior Risk Analyst Food Safety and Inspection Service (FSIS), United States Department of Agriculture (USDA) January 10, 2014

9

slide-10
SLIDE 10

Purpose

  • The purpose of this project is to:
  • Explore the question: are foodborne illnesses associated with
  • utbreaks representative of the larger collection of all sporadic

(non-outbreak) illnesses?

  • Prioritize pathogens for which outbreak data may be sufficient

to draw conclusions about source attribution

  • Contribute to an analysis of uncertainty
  • The purpose is not to estimate foodborne illness source

attribution fractions

10

slide-11
SLIDE 11

Outbreak-based attribution

  • Source attribution generally requires two key pieces of

illness information:

  • 1. the pathogen that caused the illness, and
  • 2. the contaminated food source responsible for the illness
  • FDOSS, the Foodborne Disease Outbreak Surveillance

System, includes both the pathogen and the implicated food

  • So what are the limitations of focusing on outbreaks only?
  • FDOSS cases represent a fraction of all cases

11

slide-12
SLIDE 12

FoodNet

  • Surveillance system for enteric infections
  • Collaboration between State Health Departments, CDC,

FDA and FSIS

  • CT, GA, MD, MN, NM, OR,TN
  • Selected counties in CA, CO and NY
  • Most FoodNet illnesses are sporadic
  • Cases do not identify most probable food source

12

slide-13
SLIDE 13

Is Source Attribution from Outbreaks Representative of Sporadic Cases?

  • Difficult to answer!
  • Source evidence for sporadic cases is needed
  • Therefore, a key source of attribution uncertainty is
  • The validity of the assumption that the distribution of

pathogens and their implicated food vehicles in outbreak reports reflects the relevant food exposure pathways in the general population

13

slide-14
SLIDE 14

Objective

  • H0: Case characteristics are similar for outbreak and

sporadic cases

  • If characteristics are reasonably similar between outbreak

cases and sporadic cases, then there is no empiric evidence to reject the application of attribution inferences drawn from the population of outbreaks to the broader population of non-

  • utbreak cases
  • HA: Characteristics are not similar
  • Alternatively, if characteristics are dissimilar, then empiric

evidence suggests that the application of outbreak derived attribution estimates to non-outbreak cases may be problematic

14

slide-15
SLIDE 15

Project Description - General

  • Compare geographic, demographic, temporal and clinical

characteristics of outbreak and non-outbreak cases for

  • Salmonella
  • E. coli O157:H7 (STEC)
  • Campylobacter
  • Listeria monocytogenes
  • If outbreak cases look like sporadic cases across an array
  • f epidemiologically-relevant factors, this would NOT

REJECT the plausibility that causal food exposure pathways are similar in identity and degree of incidence

15

slide-16
SLIDE 16

utsronkihgfecbaPON

Data: FoodNet Surveillance System

  • Only the FoodNet surveillance system provides data with

identified outbreak and non-outbreak cases to compare directly across predictor variables

  • We used 2004-2011 FoodNet data in this analysis

Pathogen Outbreak cases Non-

  • utbreak

cases Outbreak fraction Campylobacter 201 47,887 0.4% STEC 736 3,165 18.9% Listeria 56 1,028 5.2% Salmonella 3,273 53,810 5.7%

16

slide-17
SLIDE 17

Predictor variables

  • STATE – FoodNet location wherein case was identified
  • (CA, CO, CT, GA, MD, MN, NM, NY, OR, TN)
  • YEAR – case year (2004 – 2011)
  • SEASON – time of year case occurred
  • AGE – of case individual
  • GENDER
  • HOSPITALIZATION – was the case hospitalized or not?

17

slide-18
SLIDE 18

Classifications of predictors

  • Structural (surveillance) factors
  • STATE, YEAR and SEASON
  • Not considered fundamental epidemiologic drivers of

differences between outbreak and non-outbreak cases

  • Food source attribution estimates usually aggregated across

these predictors

  • Case factors
  • AGE, GENDER and HOSPITALIZATION
  • May indicate meaningful differences in epidemiology of
  • utbreak and non-outbreak cases
  • Differences may indicate a potential bias from using outbreak

data to estimate food sources

18

slide-19
SLIDE 19

Simplifying SEASON and AGE

19

slide-20
SLIDE 20

A two-step analytic approach

  • Step 1 - Random Forest modeling conducted to gauge the

importance of predictors

  • Tree-based models better account for interactions between

predictors, and missing observations, than traditional regression models

  • Eliminates unimportant predictors for Step 2
  • Step 2 – Logistic regression modeling conducted on

remaining predictors

20

slide-21
SLIDE 21

Results

21

slide-22
SLIDE 22

Random Forest results

  • Initially, full models included six predictor variables
  • YEAR, STATE, SEASON,AGE, GENDER and

HOSPITALIZATION status

  • GENDER and HOSPITALIZATION predictors were not

significant for all pathogens – so these were dropped

  • Misclassification statistics suggested no substantial difference in

models with or with out gender and hospitalization

22

slide-23
SLIDE 23

Gender and Hospitalization predictors were not significant

25 20 15 10 5 Female Male Hospitalized - No Hospitalized - Yes Percent outbreak cases among FoodNet cases Campylobacter

  • E. coli O157:H7
  • L. monocytogenes

Salmonella

23

slide-24
SLIDE 24

Logistic modeling

  • Examined the remaining four predictors and their

interactions in a step-wise fitting algorithm

  • Used Bayesian Information Criteria (BIC) to select best

model

Pathogen Predictors in best model Campylobacter STATE STEC STATE+YEAR Listeria STATE+YEAR Salmonella STATE+YEAR+SEASON+AGE+ STATE*YEAR + YEAR*SEASON

24

slide-25
SLIDE 25

BIC for Selecting Significant Model Predictors

Best model is one with smallest BIC. For example, STEC model with 10 STATE parameters and 8 YEAR parameters has smallest BIC value.

25

slide-26
SLIDE 26

STATE effect – substantial variability in outbreak cases across FoodNet sites

26

slide-27
SLIDE 27

STATE+YEAR effect – non-

  • utbreak cases appear more

stable than outbreak cases

Salmonella FoodNet data for two STATES with lower outbreak percents (left) and two STATES with higher outbreak percents (right)

27

slide-28
SLIDE 28

Interaction Profiles - Overview

  • Interaction profiles were conducted to look at significant

predictors of being outbreak associated

  • Crossed lines suggest “interactions” and could indicate

different food exposure pathways

  • Parallel lines indicate no interactions and perhaps food

exposure pathways are similar between outbreak and non-

  • utbreak cases
  • No interactions were found for E. coli O157:H7,

Campylobacter spp., and Listeria monocytogenes

28

slide-29
SLIDE 29

Salmonella Interaction Profile – State, Year, Season, Age

  • Crossed lines

for Year/State and Year/Season indicate interactions and perhaps exposure pathways may be different

  • Some

indication to refute H0

State Year Season Age

29

slide-30
SLIDE 30

Age as a Predictor of Salmonella Outbreak Status

  • The 0-3 years-old age range appears to be substantially
  • ver-represented among non-outbreak cases relative to
  • utbreak cases

Outbreak cases Non-outbreak cases

30

slide-31
SLIDE 31

Season effect for Salmonella:

  • utbreak peak occurs before

non-outbreak peak

31

slide-32
SLIDE 32

General Conclusions

  • Outbreak cases “look like” non-outbreak cases with

respect to case factors (age, gender, illness severity)

  • Therefore, source attribution from outbreak cases may be

applicable to non-outbreak cases?

  • Exception: AGE factor for young Salmonella illnesses
  • Outbreak cases occur differently from non-outbreak

cases with respect to surveillance factors (geography, year and season)

  • Therefore, source attribution aggregated across space and

time may not be applicable to a specific place or time?

  • Supports aggregating national outbreak evidence across

multiple years AND applying these estimates to national sporadic illnesses

32

slide-33
SLIDE 33

Summary

  • This work cannot answer if outbreak derived attribution is

representative of sporadic cases

  • Data are not available for direct comparison
  • However, the following statements can be made:
  • Campylobacter outbreak and non-outbreak cases are similar
  • However, too few data to draw conclusions
  • L. monocytogenes outbreak and non-outbreak cases are similar
  • E. coli O157:H7 outbreak and non-outbreak cases are similar
  • Salmonella: few outbreak cases among very young relative to non-
  • utbreak cases
  • Possible that sporadic cases among the youngest quintile result from non-

food sources

  • Source attribution estimates derived from aggregated outbreak information

may not be applicable to young sporadic illnesses

33

slide-34
SLIDE 34

IFSAC Project Team

  • Eric D. Ebel (FSIS)
  • Michael S.Williams (FSIS)
  • Neal J. Golden (FSIS)
  • Curtis C.Travis (FSIS)
  • R. Michael Hoekstra (CDC)
  • Dana Cole (CDC)
  • LaT
  • nia Richardson (CDC)
  • Karl C. Klontz (FDA)
  • William Lanier (FDA)

Thank you!

eric.ebel@fsis.usda.gov mike.williams@fsis.usda.gov

34

slide-35
SLIDE 35

Question & Answer Session

35

slide-36
SLIDE 36

Thank you for attending IFSAC’s webinar

  • More questions? Please send an email to the

IFSAC inbox: IFSAC@fda.hhs.gov

  • Recording: A recording of this webinar will be

posted online in the near future.

  • IFSAC Website: We’ll be launching an IFSAC

website in Winter‐Spring 2014. Please be on the lookout for an announcement soon.

36