
SLIDE 1
Water Quality Monitoring Program
Collect water quality information from tributaries to the Huron River to evaluate sources of problems and measure the degree of management success
Supported by:
- Middle Huron Partners and Stormwater Advisory Group
- Alliance of Downriver Watersheds – Lower Huron, Ecorse Creek, Combined Downriver
- Michigan Department of Environmental Quality
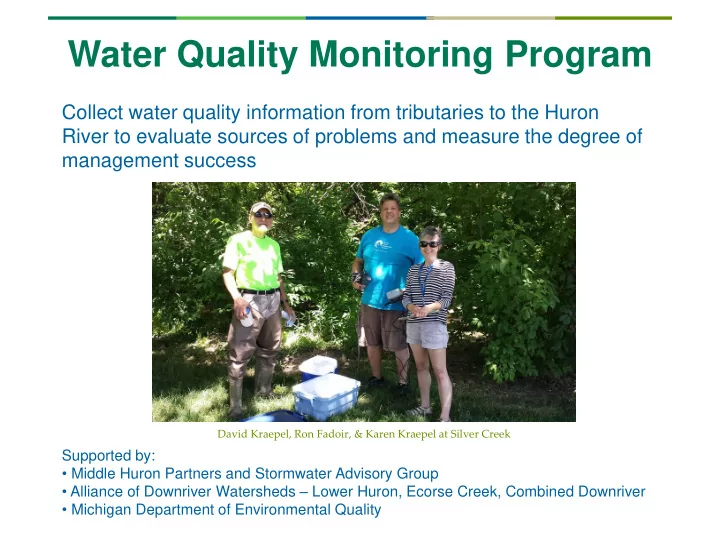
David Kraepel, Ron Fadoir, & Karen Kraepel at Silver Creek