Water Quality in Central Kentucky: Status and Issues Bluegrass - - PowerPoint PPT Presentation

water quality in central kentucky
SMART_READER_LITE
LIVE PREVIEW

Water Quality in Central Kentucky: Status and Issues Bluegrass - - PowerPoint PPT Presentation

Water Quality in Central Kentucky: Status and Issues Bluegrass Greensource Sustainability Summit, February 4, 2020, UK Gatton Center Steven J Evans UK Water Resources Research Institute Water Quality in the 20 County Area Licking River River


slide-1
SLIDE 1

Water Quality in Central Kentucky: Status and Issues

Bluegrass Greensource Sustainability Summit, February 4, 2020, UK Gatton Center Steven J Evans UK Water Resources Research Institute

slide-2
SLIDE 2

Water Quality in the 20 County Area

slide-3
SLIDE 3

River Basins

Kentucky River Licking River Salt River Green River Upper Cumberland River

About 5250 miles of streams (1:100,000)

  • 33% in ag areas
slide-4
SLIDE 4

Land Use

Row Crop – 4% Forest – 35% Development – 10% Pasture / Hay – 47%

  • About 5,250 miles of

streams (1:100,000) 33% in ag areas

  • Horse / cattle farms
slide-5
SLIDE 5

% Slope

White = 0% Yellow = 6% Orange = 15% Red = 50%

Forested on steeper slopes Pasture or city

  • n flat land
slide-6
SLIDE 6

Karst

slide-7
SLIDE 7

Karst

Mapped Sinkhole Mapped Karst Basin

Karst areas present unique challenges for tracing pollution to its source.

slide-8
SLIDE 8

Source Water Protection

Zone 3: Potential Impact Zone 1: Critical Zone 2: Responsibility

slide-9
SLIDE 9

Problems and Causes

slide-10
SLIDE 10

Fish Consumption

Unassessed Full Support Non-Support Partial Support

Mercury / methylmercury:

  • Sources: atmospheric

sources, combustion of fossil fuels, lights, mining discharges

  • Bioaccumulates in fish
slide-11
SLIDE 11

Recreational Use

Unassessed Full Support Non-Support Partial Support Thicker Dash = Secondary Use Impact Primary Secondary

slide-12
SLIDE 12

Recreational Use 2016 303(d) List

Primary Secondary

Fecal indicator Bacteria

(E.coli or Fecal Coliform)

  • Primary Contact Recreation = 491 miles
  • Secondary Contact Recreation = 72 miles

Suspected Sources:

  • Agriculture – 73%
  • (Livestock 46%, Crop 2%, Unspecified 24%)
  • Unknown 19%
  • Urban Runoff – 18%
  • Sanitary Sewer – 15%
  • Onsite Sewer or Package Plant – 12%
  • Other – 4%
slide-13
SLIDE 13

Cattle per 100 acres

  • f Farmland, 2012

Contains some of the highest densities of cattle by farmland ~238,000 cows ~57,000 horses ~24,000 sheep ~8,000 chickens ~3,000 pigs

slide-14
SLIDE 14

Public Sanitary Sewer Availability (2010)

Some counties do not have abundant access to sanitary sewer

slide-15
SLIDE 15

Sanitary Sewer System and Private Lateral Lines

slide-16
SLIDE 16

Warmwater Aquatic Habitat

Unassessed Full Support Non-Support Partial Support

slide-17
SLIDE 17

Warmwater Aquatic Habitat 2016 303(d) List

755 Miles of Impaired Waterways 1.7 pollutants on average Pollutants:

  • Nutrient / Eutrophication = 63%, 479 miles
  • Sedimentation / Siltation = 57%, 434 miles
  • Dissolved ions = 18%, 134 miles
  • Organic Enrichment (Sewage) = 17%, 128 miles
  • Cause unknown = 11%, 81 miles
  • Chlorine = 5%, 36 miles
  • Lead = 5%, 34 miles
  • Iron = 2%, 15 miles
  • Other = 1%, 8 miles

(counting nutrients as 1)

slide-18
SLIDE 18

Nutrient / Eutrophication

  • Sources
  • Fertilizer
  • Manure / Pet Waste
  • Sewage
  • Geology
  • Decay
  • Eutrophication:
  • Abundant algal growth
  • Dissolved oxygen depletion
  • Fish death
  • Harmful toxins
  • Taste and odor treatment
slide-19
SLIDE 19

Sedimentation / Siltation

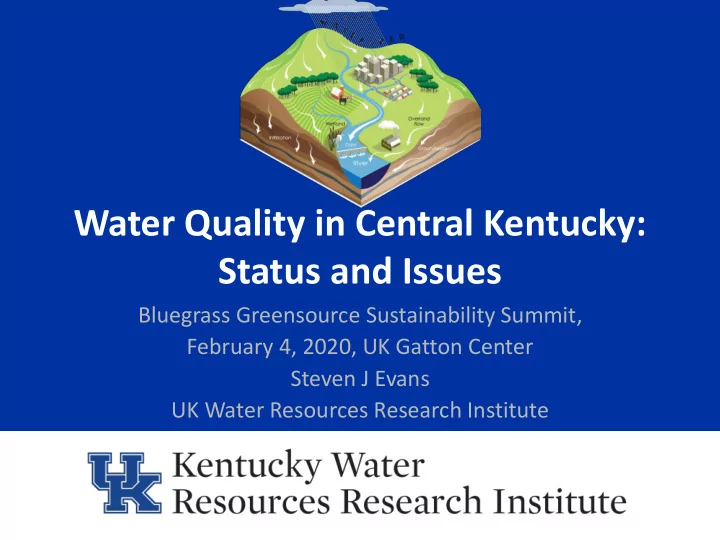
Source: FISRWG, 1998

slide-20
SLIDE 20

Sedimentation / Siltation

Stream Disturbance

Aggradation Narrowing (Bank Advancement) Degradation Widening (Bank Retreat)

Aggradation

Stream’s elevation increases due to deposition of bed sediment

Degradation

Stream’s elevation decreases due to erosion of bed sediment and incision

Narrowing

Stream width decreases due to bank building by slumping, toe benches, or berms.

Widening

Stream width increases through bank material removal from erosion, failure, and toe scouring.

slide-21
SLIDE 21

Sedimentation / Siltation

slide-22
SLIDE 22

Warmwater Aquatic Habitat 2016 303(d) List

Suspected Sources:

  • Agriculture – 70%
  • (Livestock 43%, Crop 18%, Unspecified 27%)
  • Urban Runoff – 23%
  • Habitat Loss of Modification – 23%
  • Sanitary Sewer – 20%
  • Other – 15%
  • Roadway Runoff – 11%
  • Streambank Erosion / Hydromodification – 9%
  • Construction – 5%
  • Onsite Sewer / Package Plant – 2%
slide-23
SLIDE 23

Potential Solutions

  • Ag Water Quality Plans
  • Livestock restriction from

streams

  • Alternative water sources
  • Manure management
  • Riparian planting
  • Stream restoration /

floodplain reconnection

  • Stormwater: slow it down,

spread it out, soak it in

  • Green infrastructure / Low-

Impact Development

  • Septic Repair/Replacement
  • Sanitary Sewer / Private

Lateral Repair

  • Package Treatment Plant

Removal / Replacement

  • Dog Waste Pickup Programs
  • Construction site erosion

and sediment control

  • Minimization of salt use in

de-icing

  • No home phosphorus

application without a soil test