
SLIDE 1
Water Flow Uniformity Test System Final Design Presentation Team - - PowerPoint PPT Presentation
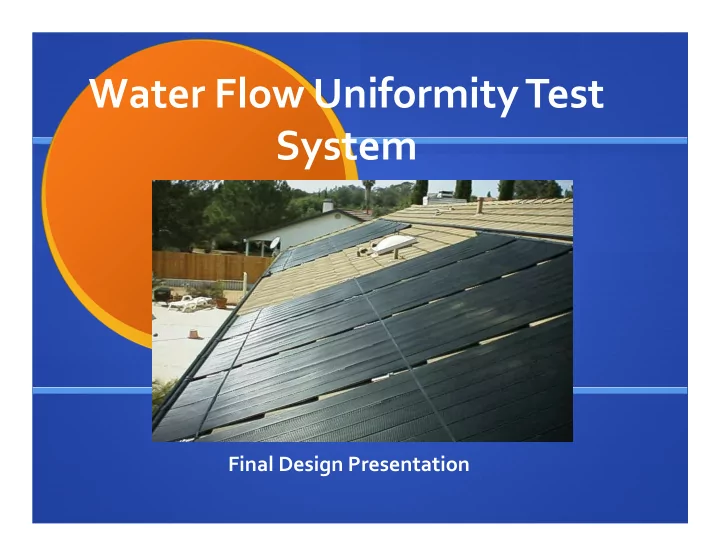
Water Flow Uniformity Test System Final Design Presentation Team Members Jonathan Cook Perla Garcia Andrew Benson MECH MECH MECH Jason Haldane Mike Rasmussen MECH MECA Project Support FAFCO (Sponsor) Mike Rubio (Technical
Jonathan Cook MECH Andrew Benson MECH Perla Garcia MECH Jason Haldane MECH Mike Rasmussen MECA
FAFCO
(Sponsor) Mike Rubio
(Technical Contact)
Greg Kallio (Advisor)
Problem
Joining header and tube array leads to obstructed tubes. Leads to a non uniform water flow in panel Reduces efficiency of panel Quality control is destructive and inefficient testing process
Need
Nondestructive, fast quality check procedure
Function of device
Accurately measure the flow rate inside each
individual tube.
To determine the number and severity of
Requirement Engineering Specification Units Target Should do/ Must du/ Would be nice Quantitative Accurate measurement Flow rate GPM ±.0008 GPM/tube Must do Quantitative Resolution Area Sq Meters 9 sq mm Must do Quantitative Complete testing quickly Time Minutes < 10 minutes Should do Quantitative Repeatability Precision Unit less ±5% Must do Quantitative Requirement Qualitative Must do/ Should do/ Would be nice Test opaque tubes non-intrusively Qualitative Must do Accommodate two standard panel sizes Qualitative Must do Automated measurement Qualitative Would be nice
−α(xn −xn+1 )
[ ]
−α(xn )
[ ] + T∞
totalCpαρ
Tsn = Surface temperature T∞ = Ambient temperature Xn= Distance between IR sensors Tmn = inside temperature Rtotal = Total resistance Cp= Specific Heat ρ = Density of water α = Cooling decay coefficient V= Volumetric flow rate
Tmi Ts1 Ts2 Ts3 X2 X3 Tm1 Tm2 Tm3
Design Changes
Frame material change from extruded aluminum to steel Switch to steel linear bearings
Calibrate the Heat Transfer Cooling
Coefficient of the system
and outside temperature (Rab)
Accuracy of the System
measured flow rate and the output flow rate
Repeatability
runs and statistical analysis was performed
Run Tmi (°C) T1 (°C) T2 (°C) T3 (°C) WEIGHT (oz) m*
1 55.9 40.3 39.7 37.7 3.4 0.053125 2 55.3 40.6 40.2 38 2.9 0.045313 3 49.7 38.9 37.9 36.2 4 0.0625 4 49.9 39.1 37.8 36.4 2.8 0.04375 5 51 39.2 39.8 36.6 2.8 0.04375 6 51.3 39.4 38.5 37 2.2 0.034375 7 51.4 39.9 38.2 36.9 2.2 0.034375
Alpha Tmn Rtotal Rab/Rtotal Rab
0.081746 54.77179 3.23242 0.455492 1.451269 0.175722 52.50114 0.43392 0.257699 50.09709 0.457506
Run Tube # Time (min) Mass (oz) V* (Measured) V* (Calculated)
1 1 1 6.7 0.052 0.017 2 1 2 9.3 0.036 0.014 3 2 2 8.2 0.032 0.019 4 2 2 6.7 0.026 0.005
6.56% Repeatability
0.005 0.01 0.015 0.02 0.025 0.03 20 40 60 80 100 120 140 160 Flow Rate (GPM) Tube Number Test 1 Test 2 Test 3
Requirement Target Should do/ Must du/ Would be nice Spec Met? Value Tested Accurate measurement ±.0008 GPM/tube Must do No Inconclusive Resolution 9 sq mm Must do Yes 5 sq mm Complete testing quickly < 10 minutes Should do Yes 4 Minutes Repeatability ±5% Must do No ±6.56% Requirement Must do/ Should do/ Would be nice Spec met? Test opaque tubes non-intrusively Must do Yes Accommodate two standard panel sizes Must do Yes Automated measurement Would be nice Yes
Sources of funding-
Industrial Sponsor Donated labor
Part Estimated cost
Hall effect sensor $21.70 Stepper drive $199.00 Power supply $136.00 I/O device $182.04 Automation direct $86.56 Tubing position sensors $87.28 IR sensors $1,451.35 Frame (Steel) $120.00 Fans $80.00 Bearings $175.00 electronic housing $62.00 hardware $15.00 Sensor opics $150.00 thermocouples $43.28 Carrage $155.11 Total Material cost $2,964 Total Estimated budget for the project Total MECH hours= 2251 Total MECA hours= 481 Estimated total hours for labor 2732 Estimated budget for labor $105,478 Estimated budget for material $2,964 Total Project cost=$108,210
Problems encountered:
Frame took a little longer than expected Positioning of sensing tubes Water heater Change of frame material
Further Calibration Required Recommended Design Changes
Add an additional lead screw Add a position home sensor
Revised specification
Relax tolerance for accuracy of flow rate
FAFCO
Tech shop Members of the team