Water Budget and Precipitation Efficiency of Typhoons Morakot (2009) - - PowerPoint PPT Presentation

water budget and precipitation efficiency of typhoons
SMART_READER_LITE
LIVE PREVIEW

Water Budget and Precipitation Efficiency of Typhoons Morakot (2009) - - PowerPoint PPT Presentation

Water Budget and Precipitation Efficiency of Typhoons Morakot (2009) Ming-Jen Yang 1 , Hsiao-Ling Huang 1 , and Chung-Hsiung Sui 2 1 National Central University, Chung-Li, Taiwan 2 National Taiwan University, Taipei,


slide-1
SLIDE 1

Water Budget and Precipitation Efficiency of Typhoons Morakot (2009)

Ming-Jen Yang1 楊明仁, Hsiao-Ling Huang1黃小玲, and Chung-Hsiung Sui2隋中興

1National Central University, Chung-Li, Taiwan 2National Taiwan University, Taipei, Taiwan

Fifth Conference on East Asia and Western Pacific Meteorology and Climate 2-4 November 2013 @ Hong Kong, China
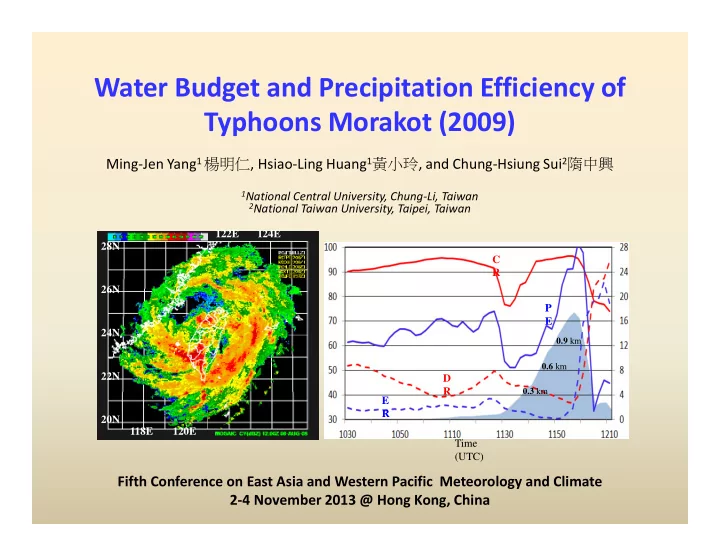
Time (UTC)

0.3 km 0.9 km

C R D R P E E R

0.6 km

122E 124E 28N 26N 24N 22N 20N 118E 120E

slide-2
SLIDE 2

Purpose

  • To improve the understanding of the physical mechanisms

producing the record-breaking rainfall (>2800 mm in 3 days) on Taiwan for Morakot (2009) from the viewpoint of changes of water budget and precipitation efficiency during the landfall process.

slide-3
SLIDE 3

Budget Equations [from Yang et al. (2011;MWR)]

Water vapor budget: qv Cloud budget: qc = qw + qi

where is the total condensation and deposition; is the evaporation and sublimation; is the net horizontal flux convergence; is the vertical flux convergence; is the divergence term is the numerical diffusion is the boundary layer source and vertical (turbulent) diffusion is the residual term is the precipitation flux.

CMPE (Cloud Microphysics Precipitation Efficiency; CMPE2, Sui et al. 2007):

slide-4
SLIDE 4

WRF domain and physics for Morakot Simulation

  • 9/3/1 km (416x301 / 541x535/ 451x628)
  • 31 sigma (σ) levels
  • Two-way feedbacks
  • No CPS is used!
  • WRF Single-Moment

6-class scheme (WSM6)

  • IC/BC: EC 1.125

lat/lon

  • Initial time: 0000 UTC,

6 Aug 2009

  • Integration length:

96 h

slide-5
SLIDE 5

Tracks from the CWB (OBS) and WRF (CTL/FLAT)

Time (UTC) SL P (hP a) OBS FLAT CTL

slide-6
SLIDE 6
  • 08/08/11 UTC

OBS @ CWB CTL FLAT

slide-7
SLIDE 7

CWB: OBS WRF: CTL

mm

Day1 Day2 Day3

slide-8
SLIDE 8

CWB: OBS WRF: FLAT

Day1 Day2 Day3

mm

slide-9
SLIDE 9

CWB_OBS WRF_CTL WRF_FLAT

3847 3392 2323 2477 2683

72-h Rainfall (08/07/00 ~ 08/10/00 UTC)

mm

slide-10
SLIDE 10

(mm h-1) Rainrate (mm h-1) Efficiency (%) CTL Run

FLAT Time

slide-11
SLIDE 11

Time (UTC) Ef fic ie nc y ( % )

Efficiency (%) Rainrate (mm h-1)

Water Vapor Budget Liquid/Ice Water Budget

slide-12
SLIDE 12
slide-13
SLIDE 13
slide-14
SLIDE 14

Further decomposition of microphysical parameters into three components

Condensation Ratio: Deposition Ratio: Evaporation Ratio:

where is the total condensation and deposition; is the cloud water condensation; is the snow deposition; is the graupel deposition; is the cloud ice deposition; is the raindrop evaporation

slide-15
SLIDE 15

Time (UTC)

0.3 km 0.9 km

CR DR PE ER

0.6 km 1.2 km

Time (UTC)

0.3 km 0.9 km

CR DR PE ER

0.6 km

Lagrangian evolution of microphysical parameters

Cell A Cell B

Efficiency 1 (%) Efficiency 1 (%) Efficiency 2 (%) Efficiency 2 (%)

slide-16
SLIDE 16

Time (UTC)

0.3 km 0.6 km

CR DR PE ER Time (UTC)

0.3 km 0.6 km

CR DR PE ER

Lagrangian evolution of microphysical parameters

Cell C Cell D

Efficiency 1 (%) Efficiency 1 (%) Efficiency 2 (%) Efficiency 2 (%)

slide-17
SLIDE 17

Longitude

0.4 km 0.8 km

CR DR PE ER Longitude

0.4 km 0.8 km

CR DR PE ER

1.2 km

Eulerian evolution of microphysical parameters In two time-and-space-averaged cross sections

Cross Section A Cross Section B

Efficiency 1 (%) Efficiency 1 (%) Efficiency 2 (%) Efficiency 2 (%)

slide-18
SLIDE 18

Conclusions

  • The 1-km WRF run reproduced resonably well the Morakot track, the
  • rganization, the sizes of eye and eyewall, major convective cells on
  • uter rainbands, and rainfall maxima on southwestern Taiwan.
  • The surface rainrate (36-54 mm/h) and PE (75-100%) over southwest

Taiwan are highly correlated.

  • The surface rainrate and PE of the no-terrain run are only 50% and 15-

20% less than those of full-terrain run.

  • By following the movement of major convective cells, PEs are 60-75%
  • ver ocean and > 95% above terrain.
  • The Lagrangian evolution of major cells shows that PE and CR are

increased on the windward slope but decreased on the lee side; the reverse trend is found for the DR and ER.

  • The Lagrangian evolution is also confirmed by the changes of

microphysical parameters across the mountains in two time-and-space- averaged cross sections in an Eulerian framework.

Reference: Huang, H.-L., M.-J. Yang*, and C.-H. Sui, 2013: Water budget and precipitation efficiency of Typhoon Morakot (2009).

  • J. Atmos. Sci., doi:10.1175/JAS-D-13-053.1, in press.
slide-19
SLIDE 19

Introduction

  • Morakot’s landfall on Taiwan occurred concurrently with the

southwesterly monsoonal flow, very slow movement and the continuous formation of mesoscale convection. (Chien and Kuo 2011; TAO)

  • The terrain of Taiwan strongly determines the Morridakot rainfall

distribution at the time of landfall. (Fang et al. 2011 in WAF; Huang et al. 2011

and Yen et al. 2011 in TAO)

  • PE (Precipitation Efficiency) was used to predict rainfall from grid-

scale vapor convergence in operational model forecasts (Doswell et al.

1996; Auer and Marwitz 1968; Heymsfield and Schotz 1985; Chong and Hauser 1989; Li et al. 2002a; Tao et al. 2004; Sui et al. 2005).

  • Yang et al. (2011; MWR) investigates the evolution of the water vapor,

cloud, and precipitation budgets of Nari (2001) prio to and after landfall on Taiwan.

  • The water budget study may help us to understand the physical

mechanisms producing the heavy rainfall on Taiwan for Morakot, and improve the microphysical parameterization for TCs in the future.

slide-20
SLIDE 20

Oceanic Stage (0000 ~ 0100 UTC 7 August 2009)

Water Vapor Budget: Liquid/Ice Water Budget:

slide-21
SLIDE 21

Landfall Stage (00730 ~ 0830 UTC 8 August 2009)

Water Vapor Budget: Liquid/Ice Water Budget:

slide-22
SLIDE 22

Gravity Waves on the Lee Side (vertical velocity: colored; hydrometeor mixing ratio: contoured)