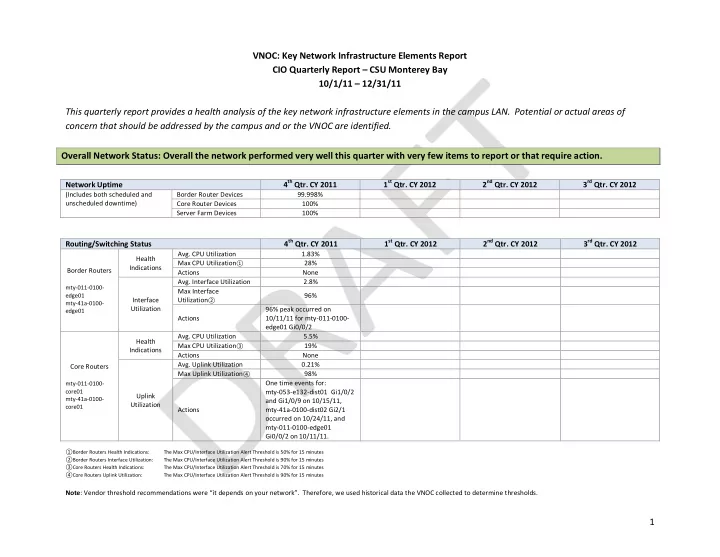
vnoc key network infrastructure elements report cio
play

VNOC: Key Network Infrastructure Elements Report CIO Quarterly - PowerPoint PPT Presentation

VNOC: Key Network Infrastructure Elements Report CIO Quarterly Report CSU Monterey Bay 10/1/11 12/31/11 This quarterly report provides a health analysis of the key network infrastructure elements in the campus LAN. Potential or actual


  1. VNOC: Key Network Infrastructure Elements Report CIO Quarterly Report – CSU Monterey Bay 10/1/11 – 12/31/11 This quarterly report provides a health analysis of the key network infrastructure elements in the campus LAN. Potential or actual areas of concern that should be addressed by the campus and or the VNOC are identified. Overall Network Status: Overall the network performed very well this quarter with very few items to report or that require action. 4 th Qtr. CY 2011 1 st Qtr. CY 2012 2 nd Qtr. CY 2012 3 rd Qtr. CY 2012 Network Uptime (Includes both scheduled and Border Router Devices 99.998% unscheduled downtime) Core Router Devices 100% Server Farm Devices 100% 4 th Qtr. CY 2011 1 st Qtr. CY 2012 2 nd Qtr. CY 2012 3 rd Qtr. CY 2012 Routing/Switching Status Avg. CPU Utilization 1.83% Health Max CPU Utilization ① 28% Indications Border Routers Actions None Avg. Interface Utilization 2.8% mty-011-0100- Max Interface edge01 96% Interface Utilization ② mty-41a-0100- Utilization 96% peak occurred on edge01 Actions 10/11/11 for mty-011-0100- edge01 Gi0/0/2 Avg. CPU Utilization 5.5% Health Max CPU Utilization ③ 19% Indications Actions None Avg. Uplink Utilization 0.21% Core Routers Max Uplink Utilization ④ 98% One time events for: mty-011-0100- core01 mty-053-e132-dist01 Gi1/0/2 Uplink mty-41a-0100- and Gi1/0/9 on 10/15/11, Utilization core01 Actions mty-41a-0100-dist02 Gi2/1 occurred on 10/24/11, and mty-011-0100-edge01 Gi0/0/2 on 10/11/11. ① Border Routers Health Indications: The Max CPU/Interface Utilization Alert Threshold is 50% for 15 minutes ②Border Routers Interface Utilization: The Max CPU/Interface Utilization Alert Threshold is 90% for 15 minutes The Max CPU/Interface Utilization Alert Threshold is 70% for 15 minutes ③Core Routers Health Indications: The Max CPU/Interface Utilization Alert Threshold is 90% for 15 minutes ④Core Routers Uplink Utilization: Note : Vendor threshold recommendations were “it depends on your network”. Therefore, we used historical data the VNOC collected to determine thresholds. 1

  2. 4 th Qtr. CY 2011 1 st Qtr. CY 2012 2 nd Qtr. CY 2012 3 rd Qtr. CY 2012 Wireless Status 84% interfaces (679) with no Access Point Interface errors, Health 16% interfaces (131) with Health errors Indications Monterey Bay VNOC Analyst Wireless Access Actions to investigate interfaces (93) Points that have 50K+ errors Avg. Access Point 0.002% Interface Utilization Utilization Max Access Point 89% Indications Interface Utilization ⑤ 89% peak one time event for Actions wap-mty-045-001-105-01 mty-aruba-41A-1-0-lc 0.18% Avg. CPU Utilization mty-aruba-41A-1-1-lc 0.19% Wireless mty-aruba-41a-2-1-mc 0.04% Health Controller Indications Working with vendor to Devices Max CPU Utilization provide data Actions None ⑤ Wireless Access Points Utilization Indications: The Max CPU/Interface Utilization Alert Threshold is 90% for 15 minutes 4 th Qtr. CY 2011 1 st Qtr. CY 2012 2 nd Qtr. CY 2012 3 rd Qtr. CY 2012 Firewall Status Firewall Interface Health 100% with no errors Health Indications Actions None Avg. Interface Utilization 0.09% Border & Server Max Interface 73% Farm Firewall Utilization ⑥ Utilization Interfaces 73% peak was a one-time Indications event occurring on 12/20/11 Actions for mty-41a-0100-intfw01 ethernet1/2 Border & Server Farm Firewall Avg. CPU Utilization 2.75% Devices mty-011-0100- edgefw01 Health Max CPU Utilization ⑦ 7% mty-011-0100- Indications intfw01 mty-041a-0100- isg2000 mty-41a-0100- Actions None intfw01 ⑥ Border & Server Farm Firewall Interfaces Utilization Indications: The Max CPU/Interface Utilization Alert Threshold is 90% for 15 minutes The Max CPU/Interface Utilization Alert Threshold is 50% for 15 minutes ⑦ Border & Server Farm Firewall Devices Health Indication: 2

  3. *End of Software Support CNI Funded Non-CNI Funded Equipment (18 month horizon) Part Quantity End of Support Date Part Quantity End of Support Date Routing/Switching Wireless Firewalls * Will incorporate this data in next report. Working to leverage Campus Inventory data from Alterpoint to provide this data. 3

Download Presentation
Download Policy: The content available on the website is offered to you 'AS IS' for your personal information and use only. It cannot be commercialized, licensed, or distributed on other websites without prior consent from the author. To download a presentation, simply click this link. If you encounter any difficulties during the download process, it's possible that the publisher has removed the file from their server.

Recommend


More recommend