
SLIDE 1
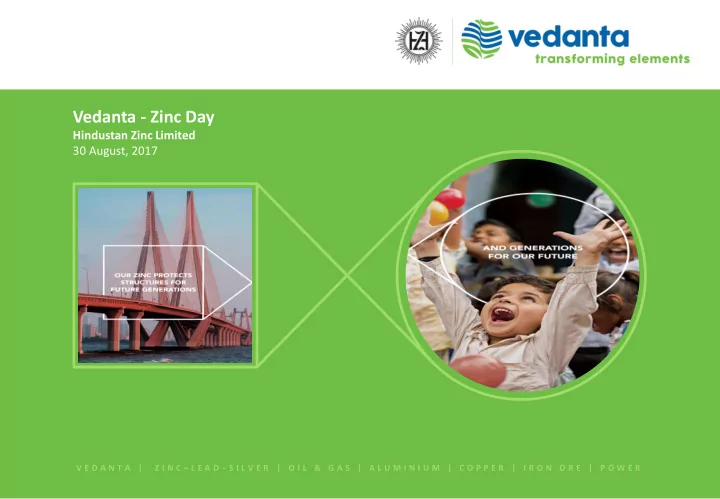
Vedanta - Zinc Day
Hindustan Zinc Limited 30 August, 2017
V E D A N T A | Z I N C – L E A D – S I L V E R | O I L & G A S | A L U M I N I U M | C O P P E R | I R O N O R E | P O W E R
Vedanta - Zinc Day Hindustan Zinc Limited 30 August, 2017 V E D A N - - PowerPoint PPT Presentation
Vedanta - Zinc Day Hindustan Zinc Limited 30 August, 2017 V E D A N T A | Z I N C L E A D S I L V E R | O I L & G A S | A L U M I N I U M | C O P P E R | I R O N O R E | P O W E R Cautionary Statement and Disclaimer
Hindustan Zinc Limited 30 August, 2017
V E D A N T A | Z I N C – L E A D – S I L V E R | O I L & G A S | A L U M I N I U M | C O P P E R | I R O N O R E | P O W E R
Cautionary Statement and Disclaimer
The views expressed here may contain information derived from publicly available sources that have not been independently verified. No representation or warranty is made as to the accuracy, completeness, reasonableness or reliability of this information. Any forward looking information in this presentation including, without limitation, any tables, charts and/or graphs, has been prepared on the basis of a number of assumptions which may prove to be incorrect. This presentation should not be relied upon as a recommendation or forecast by Vedanta Resources plc and Vedanta Limited and any of their subsidiaries. Past performance of Vedanta Resources plc and Vedanta Limited and any of their subsidiaries cannot be relied upon as a guide to future performance. This presentation contains 'forward-looking statements' – that is, statements related to future, not past, events. In this context, forward-looking statements often address our expected future business and financial performance, and often contain words such as 'expects,' 'anticipates,' 'intends,' 'plans,' 'believes,' 'seeks,' or 'will.' Forward–looking statements by their nature address matters that are, to different degrees, uncertain. For us, uncertainties arise from the behaviour of financial and metals markets including the London Metal Exchange, fluctuations in interest and or exchange rates and metal prices; from future integration of acquired businesses; and from numerous other matters of national, regional and global scale, including those of a environmental, climatic, natural, political, economic, business, competitive or regulatory nature. These uncertainties may cause our actual future results to be materially different than those expressed in our forward- looking statements. We do not undertake to update our forward-looking statements. We caution you that reliance on any forward-looking statement involves risk and uncertainties, and that, although we believe that the assumption on which our forward-looking statements are based are reasonable, any of those assumptions could prove to be inaccurate and, as a result, the forward-looking statement based on those assumptions could be materially incorrect. This presentation is not intended, and does not, constitute or form part of any offer, invitation or the solicitation of an offer to purchase, otherwise acquire, subscribe for, sell or otherwise dispose of, any securities in Vedanta Resources plc and Vedanta Limited and any of their subsidiaries or undertakings or any other invitation or inducement to engage in investment activities, nor shall this presentation (or any part of it) nor the fact of its distribution form the basis of, or be relied on in connection with, any contract or investment decision. 2
Agenda
3
Amitabh Gupta, CFO
Naveen Singhal, Director Projects
Neelima Khetan, Head CSR
Scott Caithness, Head Exploration
Sunil Duggal, CEO
Sunil Duggal, CEO
Corporate Overview
5 Rampura Agucha: 2nd largest zinc mine globally
2nd largest zinc-lead miner globally with 12 million+ MT of ore production capacity 4th largest zinc-lead smelter globally: 1 million+ MT
18th largest silver producer of the world*
Rankings source: (1) Wood Mackenzie, Long-Term Outlook Q2 2017 (2) For HZL related data, actuals for FY 16-17 * Source : Thomson Reuters
Vision: To be the world’s largest and most admired zinc-lead & silver company
One of the lowest cost zinc producers in the world 3 mines with five-star ratings by Indian Bureau of
Mines
Core Strengths
Hindustan Zinc
Peer 1 Peer 2 Peer 3 Peer 4 Peer 5 10 20 30 40 50 60 70 80 90 100 250 500 750 1000 1250 1500 1750 2000 2250 2500
C1 Cash Cost ($/t Zn) Cumulative Production (Percentile) Zinc Mine Composite Costs Curve
Captive mines with R&R base of 404.4 million MT ensuring mine life of 25+ years Integrated metal production supported by captive power plants Low cost of operations driven by quality assets and recovery from waste Market leadership in India with strong presence in emerging economies of Asia
What Differentiates Us?
6
Source: Wood Mackenzie Research (Q2 2017)
1 2 3 4 Leading the Way with Fully Integrated Operations
Among the Lowest Cost Producers of Zinc
Note: C1 cash cost includes by-product credits
LTIFR Trend
Safety & Environment – Vision Zero Harm
0.30 0.39 1.40 1.30 0.49 1.85 1.20
HZL Vedanta Glencore Xstrata Rio Tinto Vale Anglo American Antofagasta
LTIFR Benchmarking (One million man-hours)
Source: SD report 2016 of all companies
Water Conservation
requirement met from recycling/ reuse water (2017)
disclosure 2017
14.56 13.78 13.70 15-16 16-17 17-18 (Target)
Specific Water Consumption (M3 / MT of MIC)
Climate Change & Energy
reduction (2017)
& Scope 3 GHG emission
Specific Energy Consumption (GJ / MT of MIC)
23.49 21.33 21.30 15-16 16-17 17-18 (Target)
Waste Management
waste minimisation
SKM and RAM UG
from waste
waste
75 49 44 15-16 16-17 17-18 (Target)
Total Waste Generation (Million MT)
*Waste includes mining waste
7
Peer 1 Peer 2 Peer 3 Peer 4 Peer 5
Portfolio of Tier - 1 Assets
8
Zawar Mining Complex
Reserves : 9.5 mn MT Resources : 85.7 mn MT Reserve Grade : Zn 3.3%, Pb 1.8% Current Ore Capacity : 4.00 mtpa CPP : 80 MW
Renewable Power
Wind: 274 MW Solar: 16 MW Waste heat recovery: 35 MW
Sindesar Khurd Mine
Reserves : 35.6 mn MT Resources : 87.2 mn MT Reserve Grade : Zn 4.2%, Pb 2.9% Current Ore Capacity : 4.50 mtpa
Rajpura Dariba Mine
Reserves : 9.0 mn MT Resources : 50.3 mn MT Reserve Grade : Zn 6.3%, Pb 1.5% Current Ore Capacity : 0.90 mtpa
Rampura Agucha Mine
Reserves : 49.7 mn MT Resources : 50.3 mn MT Reserve Grade : Zn 13.9%, Pb 1.9% Current Ore Capacity : 6.15 mtpa
Kayad Mine
Reserves : 5.4 mn MT Resources : 1.7 mn MT Reserve Grade : Zn 7.8%, Pb 1.1% Current Ore Capacity : 1.00 mtpa
Chanderiya Smelting Complex
Pyrometallurgical Lead Zinc Smelter: 1,05,000 MTpa zinc and 35,000 MTpa lead Hydrometallurgical Zinc Smelter: 4,20,000 MTpa zinc AusmeltTM Lead Smelter: 50,000 MTpa lead Captive Power Plant: 234 MW
Zinc Smelter Debari
Hydrometallurgical Zinc Smelter: 88,000 MTpa zinc
Dariba Smelting Complex
Hydrometallurgical Zinc Smelter: 2,10,000 MTpa zinc Lead Smelter: 1,00,000 MTpa lead Captive Power Plant: 160 MW
Pantnagar & Haridwar
Processing and refining of zinc, lead and silver
Mined Metal (kt) – 3X Growth Reserves & Resources (mn MT) – 2.5X Growth
Strong Track Record of Growth
9
54 67 69 77 80 89 102 97 109 110 104 108 107 109 92 98 109 133 152 183 197 216 223 239 261 267 283 295 146 165 178 210 232 272 299 313 332 348 365 375 390 404 FY04 FY05 FY06 FY07 FY08 FY09 FY10 FY11 FY12 FY13 FY14 FY15 FY16 FY17 Reserve Resource Net R&R 262 317 355 472 505 551 651 683 752 739 765 770 774 744 756 36 47 54 60 67 78 84 86 88 92 106 110 113 145 151 298 364 409 532 572 629 735 769 840 830 870 880 887 889 907 FY03 FY04 FY05 FY06 FY07 FY08 FY09 FY10 FY11 FY12 FY13 FY14 FY15 FY16 FY17 MIC - Zinc MIC - Lead Total Mined Metal 47 35 11 24 51 80 105 139 148 202 288 301 266 422 453 FY03 FY04 FY05 FY06 FY07 FY08 FY09 FY10 FY11 FY12 FY13 FY14 FY15 FY16 FY17
Ore Production (mn MT) – 3.5X Growth Silver Metal – Integrated Saleable (MT) – 9X Growth
Multi-fold growth since disinvestment
10.00 15.00 20.00 25.00 FY02 FY03 FY04 FY05 FY06 FY07 FY08 FY09 FY10 FY11 FY12 FY13 FY14 FY15 FY16 FY17
PAT
20.00 30.00 40.00 50.00 60.00 70.00 80.00 90.00 FY02 FY03 FY04 FY05 FY06 FY07 FY08 FY09 FY10 FY11 FY12 FY13 FY14 FY15 FY16 FY17
Robust Financial Performance
10
EBITDA CAGR 28% despite Zinc LME growth of only 7%
EBITDA
Cash & Cash Equivalents*
100.00 150.00 200.00 250.00 300.00 350.00 400.00 FY02 FY03 FY04 FY05 FY06 FY07 FY08 FY09 FY10 FY11 FY12 FY13 FY14 FY15 FY16 FY17 Special Dividend payout
EPS
Rs.
400.00 600.00 800.00 1,000.00 1,200.00 1,400.00 FY02 FY03 FY04 FY05 FY06 FY07 FY08 FY09 FY10 FY11 FY12 FY13 FY14 FY15 FY16 FY17
Market Cap
1,000 1,500 2,000 2,500 3,000 3,500 4,000 FY02 FY03 FY04 FY05 FY06 FY07 FY08 FY09 FY10 FY11 FY12 FY13 FY14 FY15 FY16 FY17
Zinc LME Lead LME
LME Price
$/MT
*net off dividend accounts & temporary borrowings; includes investments at fair value & interest accrued thereon
Cost Journey
11
kt
COP held firm despite transition to underground mining
Post commissioning of shafts at RA & SK mines
733 670 638 544 426 137 210 249 345 481 1200 835 844 870 804 830 800 200 400 600 800 1000 1200 1400 100 200 300 400 500 600 700 800 900 FY13 FY14 FY15 FY16 FY17 Target
Mined Metal & COP Trend
OC (kt) UG Mines (kt) Zinc COP excl royalty ($/MT)
Corporate Social Responsibility
13
Reach
Over half a million people in Rajasthan; positively impacting lives of more than 100,000 households
Vision
To enhance the quality of life and economic well being
Goals
approach for innovatively, effectively and efficiently addressing development challenges.
HZL is proud to have had an unbroken social license to operate for the last 5 decades
Principles & Focus areas
14 Neighbourhood Communities Our first and foremost commitment The Partnership Multiplier Work, as much as possible, through strong and credible local partners Impact Centric In almost everything we do, we focus on impact rather than on spends Strong Governance Multi-tiered and objective governance structures and routines
Core Principles Thematic Areas
Touching Lives of Neighbourhood Communities
15
Children (0-6 Years) Students Rural Youth Specially Abled Women Farmers Environment Culture Nandghar; Khushi Anganwadi Shiksha Sambal Unchi Udaan ‘SAKHI’- Women’s empowerment initiative ‘Samadhan’ – Integrated agriculture and livestock development Clean Ayad river, the lifeline of Udaipur (STP) Project Gulshan ‘Ajmer Dargah Complex’ – A Swachh iconic place Jeevan Tarang… Zinc Ke Sang HZL Mining Academy Football Academy
History of Project Delivery
17
2005
Zn Hydro-1 at Chanderiya (170 kt)
2006
Ausmelt at Chanderiya (50 kt)
2008
Zn Hydro-2 at Chanderiya (170 kt)
2010
Zn Hydro-3 at Dariba (210 kt)
2012
Pb Smelter Dariba (100 kt) Silver refinery Pantnagar (500 MT)
2007
SKM 0.3 mtpa
2009
RA OC 3.75 to 5 mtpa
2013
Production commenced at Kayad Mine
2012
SKM 0.3 to 2 mtpa
2017
SKM 3 to 3.7 mtpa RAUG 1.4 mtpa SK Mill commissioned
2010
RA OC 5 to 6 mtpa
2016
SKM 2 to 3 mtpa 2*77 MW Chanderiya 80 MW Chanderiya 80 MW Zawar 80 MW Dariba 80 MW Debari
Captive Power
MW
154 234 314 394 474
2005 2008 2009 2010 2011
2005
RA OC 2.3 to 3.75 mtpa
MW
Mine Expansion Project Overview
18
including RAM OC replacement
Underground Mines Capacity Expansion
3.8 mtpa 17.5 mtpa
2.0 1.2 0.6 4.5 4.0 1.0 3.3 0.9 RAUG SKM Kayad Zawar RDM Pre Expansion Planned (FY 2020) 5.5 5.0 4.5 3.3 3.8 4.4 6.0 8.8 17.5 9.3 9.4 10.5 12.1 17.5 FY 14 FY 15 FY 16 FY 17 FY 20 Open Pit UG
UG ramp up 5 year CAGR 39%
OC to UG Transition
Underground Mines – concurrent expansion
Zawar – integrating multiple mines
Reserve & Resource
: 95.2 mn MT Sindesar Khurd Mine – satellite lenses
Reserve & Resource : 122.8 mn MT
Rampura Agucha – a mine in transition
Reserve & Resource : 100.0 mn MT
Balaria Mines 19
Rajpura Dariba Mine – upgrading a legacy
Reserve & Resource : 59.3 mn MT
Kayad Mine – near mine exploration
Reserve & Resource : 7.1 mn MT
Diverse ore bodies require different mining solutions
Project Philosophy
20
, Mining schemes by AMC, Australia and reviewed by Golder, Canada
Robust Mine Plan Best-in-Class Execution Partners
Talent Pool
World-Class Infrastructure
Technology & Innovation in Mines
21
Technology Initiatives Mine Planning Mine Operation Cavity Monitoring System: Stope scanning identifies and minimises deviation Refuge Chamber: First of its kind in the country, provides a safe refuge during UG emergency Mobile Carrier Rig: Eases mobility of exploration drills 1500 KW Ventilation Fan: First of its kind in the country, provides best UG working environment. Measurement 3D numerical modelling for stope and pillar design In-situ stress measurement 3D design using datamine Schedule simulation using 5D planner Shaft sinking modelling Best-in-class mining equipment Virtual reality and simulation-based training Mine digitisation and tele remote 3D scanning with laser scanner Electronic shot firing
Accelerated focus on safety & productivity leveraging technology
Phase 2 : December 2018
Smelters – Equipped for 1.2 mn MT
22 Smelter Debottlenecking Process & Technology Metal Process Technology Zinc Hydro Metallurgy Outokumpu roast-leach-electro winning technology Pyro Metallurgy Imperial smelting technology Lead Pyro Metallurgy Imperial smelting technology Ausmelt Top Submerged Lance technology SKS, bottom blowing technology
Phase 1 : December 2017 Smelter Capacities After Debottlenecking
kt
Metal Recovery in Hydro
620 648 648 320 334 460 88 92 92 1028 1074 1200 200 400 600 800 1000 1200 1400 Current Phase I Phase II Chanderiya Dariba Debari Total 96.75 0.00 0.00 97.50 90.00 92.60
40.00 60.00 80.00 100.00 120.00 Zinc Lead Silver Exisiting Metal Recovery Enhanced metal recovery with fumer (pilot project commissioning in mid FY 2019)
Metal recovery %
Exceptional Exploration Success
24
underpins 25+ years of production at current rate
standard and audited by international consultants
add new resource tonnage
grow R&R
technologies
80 89 102 97 109 110 104 108 107 109 152 183 197 216 223 239 261 267 283 295 27.5 31.5 34.1 34.7 35 34.1 35.2 35.3 36.1 36.1
5 10 15 20 25 30 35 40 50 100 150 200 250 300 350 400 450 FY08 FY09 FY10 FY11 FY12 FY13 FY14 FY15 FY16 FY17
10 Year R&R Trend
Reserve Resource Contained Metal
Sustained Commitment to Exploration → Strong Track Record of R&R Addition
Mn MT
Every year since disinvestment, we have added more than depleted
Resource-Driven Growth
Zawar Targets
strike
zones grading+5oz/t Ag
6% Zn+Pb
in soils and ancient mine workings
clearance and drilling
provide potential for greenfield discoveries Zawar Bonanza Silver
Existing ore bodies being mined
Targets being explored
Exploration Technologies
26
Sindesar Khurd 3D Model
Using Global Leading Exploration Technologies
High speed drill rig at Kayad Mine
Ore body Drill hole
Zn Ag Pb (kt) (kt) (MT) 278% growth 41% growth 138% growth
deposits
E
Silver – Fastest Growing Portfolio of Hindustan Zinc
Strong Management Focus to Drive Silver Portfolio
Refined metal includies captive consumption
28
256 311 400+ 570+ FY 16 FY 17 FY 18 FY 19 422 452 500 + 700 + 1,000 FY 16 FY 17 FY 18 FY 20
SKM
recovery
(0100)
38% upside
Hindustan Zinc Poised to be Among ‘Top 5 Silver Companies’ Silver Portfolio – Growth
29 Global Production (MT) Ranking 2016
Source : Metals Focus and *Reuters
Growth in Integrated Production (MT) – HZL Global Production (MT) Ranking 2016 - Mines
Source : Metals Focus
Growth in Production (MT) - SKM
1421 1241 1216 908 873 436 Fresnillo KGHM Glencore Polymetal Goldcorp Hindustan Zinc 1244 790 681 659 566 270 KGHM Miedz Dukat Saucito Escobal Cannington Hindustan Zinc
14.0 7.0 11.7 8.5 11.5 10.7
1 2 3 4 5 18 1 2 3 4 5 15
27% upside
mine
satellite lenses
FY 20
EV/EBITDA (FY17)*
Key Focus Areas Mining (452 850)
ongoing
recoveries in mines;
May 18 Zinc Smelters (0 100)
June 18 (first fumer)
April 20 (plan) Recovery from Tailings (0 50)
June 18 (pilot) Silver in Ore (FY 2017) 748 MT (100%) Lead/Bulk Concentrates 470 MT (63%) Lead Smelting Refined Silver 452 MT Zinc Concentrates Mine Tailings 112 MT (15%) 165 MT (22%) Zinc Smelting Tailings 0 MT 0 MT 452 MT FY 2017 1,000 MT
Silver Portfolio – Realising Potential of 1,000 MT
30
Way Forward
32
1.5 mtpa capacity under planning
Shaft and decline integration Multi-level mining Digital transformation New prospects & tenements R&R addition 25+ years of mining R&R with potential of 1.2 mtpa Transition to underground mining progressing smoothly Shaft commissioning on track for Q3 FY 2019 Mill & smelter capacity to keep pace Reduction in COP on shaft commissioning
1.2 mtpa capacity by FY 2020
Mined metal: Higher than 907 kt of FY 2017 Refined zinc-lead: 950 kt; silver: 500 +MT Marginally higher dollar COP (excluding royalty) Project Capex of $350-360 million (including
debottlenecking)
Outlook FY 2018
World’s second largest zinc- lead miner with 25+ year mine life Proven track record on exploration success Integrated
low cost producer with high quality assets Robust project management Accelerated growth of silver Experienced and committed management team Impacting more than 5,00,000 lives through CSR
Strong zinc fundamentals Summary
33
capacity by March 2020
expansion to 1.5 mtpa
INPUTS
Particulars UOM Value 1 Mined metal production kt 1,200 2 Metal production - Zinc kt 979 3
kt 173 4 Silver production kt 750 5 Realisation* - Zinc $/MT 2,950 6
$/MT 2,350 7
$/Troz 17.00 8 Cost Of Production(COP) - Zinc $/MT 800 9
$/MT 700 10
$/Kg 20 11 Royalty
% 13.20 12
19.14 13
9.24 14 Exploration and others $ mn 30 15 Sustaining capex 80 16 Project capex 320 SAMPLE FINANCIAL WORKING 17 Revenue – Zinc $ mn 2,889 18
406 19
410 20 Total Revenue 3,705 21 COP - Zinc 783 22
121 23
15 24 Total COP 919 25 Royalty
381 26
78 27
38 28 Total Royalty 497 29 EBITDA Metal 2,258 30 EBITDA Wind Power 25 31 EBITDA Total 2,283 30 Operational Free Cash** 1,916
*Includes conservative LME & Premium **Excludes treasury income and working capital movement
Sample Financial Working & Sensitivity
35
EBITDA ($ mn) Increase in LME Zinc ($100/MT) 82 Lead ($100/MT) 17 Silver ($1/Toz) 20 Every $10/MT increase in COP Zinc 9 Lead 2 Every 10kt increase in volume Zinc 19 Lead 13
Cost Sensitivity
All the above are individual Sensitivities and assume that the other parameters in the sample calculations stay constant
Rampura Agucha Mine
Open Pit Ultimate Pit Depth : 400 metres from surface UG Mine
: 4.5 mtpa
: LHS with paste fill Major Activities
Shaft
North Vent Shaft South Vent Shaft Main Shaft Year Milestone 2013
2015
2016
2017
2018
36 R&R 100.0 mn MT
Sindesar Khurd Mine
37
UG Mine
: 6.0 mtpa
: Long hole stoping with paste filling
Major Activities
Shaft
Year Milestone 2013
2014
2015
2016
2017
2018
R&R 122.8 mn MT
Rajpura Dariba Mines
38
East Lens Surface Ramp Auxiliary Shaft
Main Shaft North Lens South Lens 100mRL Main Lens SL1 E1,10, 11 N OW OZ East Lode Surface Ramp Auxiliary Shaft
Main Shaft North Lode South Lode 100mRL Main Lode SL1 E1,10, 11 OW OZ
UG Mine
: Through ramp and shaft
: Blast hole stoping with hydraulic filling
: Through ramp and shaft Major Activities
R&R 59.3 mn MT
Zawar Mines
UG Mine
: Through ramp and shaft
: Through ramp and shaft
: Blast hole open stoping
: Through ramp and shaft Major Activities Ramp up to 4.5 mtpa ore production capacity
Year Milestone 2015
2016
2017
2018
2019
39 R&R 95.2 mn MT
Kayad Mine
R&R 7.1 mn MT
UG Mine
: Through ramp
: Long hole open stoping with filling
: By 50 T LPDT through ramp
: By 50 T LPDT through ramp Major Activities
40