
SLIDE 1
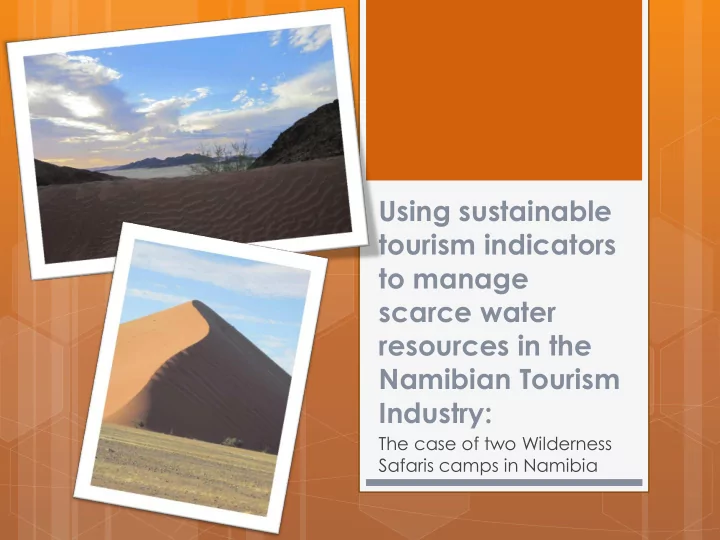
Using sustainable tourism indicators to manage scarce water resources in the Namibian Tourism Industry:
The case of two Wilderness Safaris camps in Namibia
Using sustainable tourism indicators to manage scarce water - - PowerPoint PPT Presentation
Using sustainable tourism indicators to manage scarce water resources in the Namibian Tourism Industry: The case of two Wilderness Safaris camps in Namibia Introduction Aim: To demonstrate through a case study how sustainable tourism
The case of two Wilderness Safaris camps in Namibia
Aim: To demonstrate through a case study how
Namibia Southern Africa Scarce water regions around the world
Global water usage has tripled over the last five
By 2025 it is predicted that 3 billion people will live in
“Tourism has expanded rapidly since World War II, today it is seen as an important part of global economic activity and a cornerstone of many national, regional and local economies” (Keyser, 2009: 3)
The business volume of tourism equals or even surpasses that of oil
exports, food products or automobiles” (UNWTO, 2011: 1)
Tourism industry is the world’s largest industry. It accounts for 9% of the world’s Gross Domestic Product (GDP) It contributes $7 trillion US dollars to the global economy.
(WTTC, 2014)
The tourism industry is heavily dependant on water and is
Any change in the availability of water and or the quality of
“Consumption of water per capita by tourists is typically
The vast amount of water consumption at the hands of
Despite these impacts there is also a lack of statistical data
Records on the industry's water use are largely unknown, as
The rapid growth of the tourism industry, the growth in water
Namibia boasts a unique array of tourism offerings. Namibia’s desert areas are highly sensitive. Which requires effective management to ensure
The Namib-Naukluft National Park boasts the largest
“Namibia’s protected areas are without a doubt the
Namibia is the driest country in Southern
Low erratic rainfall (Oct-May) Mean annual rainfall around the study area
83% total rainfall evaporates 14% used by vegetation 2% contributes to runoff 1% recharges ground water source
(Crerar and Bethune, 1992).
The company Wilderness Safaris operates camps and safaris
Wilderness Safaris is a conservation organisation and
Wilderness Safari’s aim to share some of the most remote
Little Kulala
Kulala Wilderness Camp
Dead Vlei Dune 45
Sossusvlei Dead Vlei World’s highest sand dunes:
Dune 45, Big Daddy and Big Mamma
The camp is situated in a dry riverbed in the Kulala Wilderness
The camp was designed to resemble Dead Vlei 5 star premier camp 11 thatched tents Accommodates up to 24 guests per night
Situated 18 kilometres to the east of Little Kulala Camp KWC lies on the slope of a ancient volcanic mountain in the
It is classified as an adventure camp, being more rustic and
Ten semi permanent tents Accommodates up to 22 guests per night
The World Tourism Organization (WTO) developed a guidebook in
2004 with a new approach to indicator development.
Baseline indicators suggested by the WTO (2004) were selected to
assess the sustainable performance of each camp in terms of their water use.
According to the WTO (2004a), a good indicator must address
key issues within a destination, should be practical to implement, and should be able to be used as a benchmark for future comparisons, both within the destination and with other destinations.
They support better decision making. They assist in informing action plans for destination management.
(Total water volume consumed per camp per annum and litres per tourist per day)
Main source of water is
Secondary source of
LKC and KWC do not
Due high levels of
Store borehole water in
Store borehole water in
Management provided estimated figures
To determine the total volume of water
Estimated data on borehole water use was
Little Kulala Camp (in litres) Kulala Wilderness Camp (in litres) Average water use per guest per day 1 249 litres 463 litres
Tourism benchmarks have been developed to help provide tourism
ventures with guidelines to measure their sustainable performance against international standards.
To assess the level of sustainability of each camp, results were
compared with an international benchmark (International Tourism Partnership).
European international benchmarking standard for hotels. Such standards are ineffective when measuring emerging tourism
ventures within the developing countries.
The nature of tourism ventures in developing countries differ from those
found in developed countries
In developing countries (Staff predominantly stay on the premises and
therefore contribute to resource use, such as water and energy
In developed countries (staff do not stay at the destination but return home
after their work shift)
Average water use per person per day Little Kulala Camp (in Litres) Kulala Wilderness Camp (in Litres) 2010 362 149 2011 350 142 2012 (Jan-Apr) 260 133
International Tourism Partnership (ITP) (2008) Daily per capita water consumption in (litres) benchmark for hotels
Excellent Satisfactory High Less than 200 200-250 More than 250
Reverse Osmosis to purify guest drinking water. For every 1 litre of water that undergoes reverse
Leaking water infrastructure Corrosion of water pipes and lime scale
Each guest room has a private plunge pool as
KWC has one big pool at main camp LKC employs 39 staff members KWC
Lack of dual flush toilets in staff village Leaking infrastructure
Towel policy Water-saving measures Chemical policy
The quality of drinking water is an essential factor in terms of guest
and staff wellbeing.
This indicator was used to measure if the camps water was
suitable for human consumption and did not pose a health risk to tourists and staff
The water quality results were compared to the South African
National Standard for drinking water quality in terms of the physical and macro-chemical characteristics
Water quality determinant Unit of measurement Class I (recommended
limit) Class II (maximum allowed for limited duration) Class III (maximum water consumption period*) Results of LKC water quality analysis Results of KWC water quality analysis
Physical characteristics of LKC water pH value pH units 5.0 - 9.5 4.0 - 10.0 No limit 8.41 7.95 Electrical conductivity (EC) mS/m <150 150 - 370 7 years 175.60 110.60 Total dissolved solids (TDS) mg/l < 1000 1 000 - 2 400 7 years 1321 739 Macro-determinants (chemical characteristics of LKC water) Ammonium (NH4) mg/I as N <1.0 1.0 - 2.0 No limit 0.191 0.173 Calcium (Ca) mg/I <150 150 - 300 7 years 14.560 60.013 Chloride (CI) mg/I <200 200 - 600 7 years 252.7 99.3 Fluoride (F) mg/I <1.0 1.0 - 1.5 1 Year 4.592 1.732 Magnesium (Mg) mg/I <70 70 - 100 7 years 14.216 40.362 Nitrate (NO3) mg/I as N <10 10 - 20 7 years 3.038 2.273 Nitrite (NO2) mg/I as N <10 10 - 20 7 years 0.078 0.079 Potassium (K) mg/I <50 50 - 100 7 years 7.261 5.693 Sodium (Na) mg/I <200 200 - 400 7 years 438.66 160.22 Sulphate (SO4) mg/I <400 400 - 600 7 years 345.04 206.04 Zinc (Zn) mg/I <5.0 5.0 - 10 1 Year 0.004 0.004
From the application of the above indicators it was found that: In terms of water use LKC is unsustainable Both camps need to improve their conservation measures The water quality at LKC and KWC is unsustainable in terms of staff consumption.
The mineral properties associated with LKC and KWC’s water has caused serious lime scale build up, corrosion and scaling.
Both camps water quality is unsustainable, as it is a source of unnecessary financial costs to maintain and replace plumbing infrastructure, due to corrosion, scaling cause by the high mineral content of the water.
Both LKC and KWC’s must improve their water quality as it is unfit for staff consumption, due to the high level of fluoride in the water.
Possibly install water purification systems or use alternative source of water.
Educate staff on the negative impacts of drinking untreated water from the borehole.
Both camps need to accurately record their water consumption. However it is recommended that both camps install a water softening or condition systems close to the borehole water.
Water meters should only be installed after water has passed through water softening treatment.
Waste water from reverse osmosis should be recaptured, treated to remove unwanted chemical determinants and used in camps toilet s and showers.
Assess ground water source, to ensure they do not exhaust ground water reserves.
Despite the camps high water use, both camps are making
an effort to conserve water through practical measures.
There is a need to develop benchmarks for developing
countries
This data collected by the study can be used by the camps
as baseline data to continually measure and improve their sustainable performance in the future.
These indicators must be applied on a annual basis to
measure if management plans have been effective and to monitor changes.
These indicators can be used in tourism ventures across
Southern Africa to help measure and monitor their water use.