
SLIDE 1
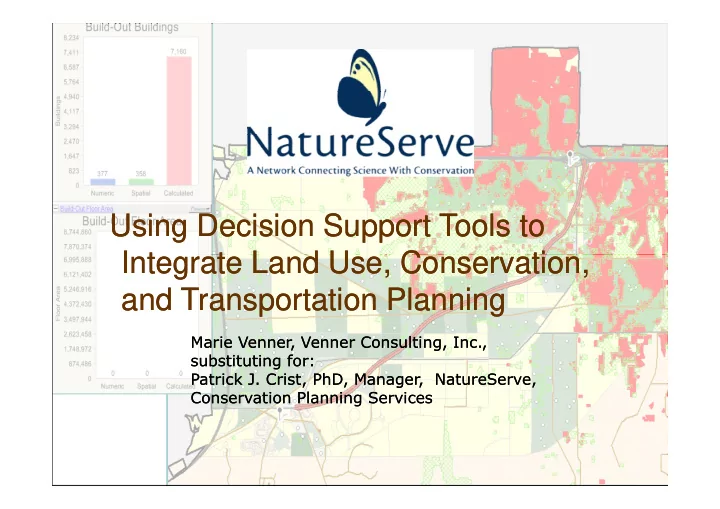
Using Decision Support Tools to Integrate Land Use, Conservation, Using Decision Support Tools to Integrate Land Use, Conservation, Integrate Land Use, Conservation, and Transportation Planning Integrate Land Use, Conservation, and Transportation Planning
Marie Venner, Venner Consulting, Inc., substituting for: Patrick J. Crist, PhD, Manager, NatureServe, Conservation Planning Services Marie Venner, Venner Consulting, Inc., substituting for: Patrick J. Crist, PhD, Manager, NatureServe, Conservation Planning Services