U SE OF D ECISION U NIT AND I NCREMENTAL S AMPLING M ETHODS TO I - - PowerPoint PPT Presentation

u se of d ecision u nit and i ncremental s ampling m
SMART_READER_LITE
LIVE PREVIEW

U SE OF D ECISION U NIT AND I NCREMENTAL S AMPLING M ETHODS TO I - - PowerPoint PPT Presentation

U SE OF D ECISION U NIT AND I NCREMENTAL S AMPLING M ETHODS TO I MPROVE S ITE I NVESTIGATIONS 2015 M2S2 Webinar Series Munitions Constituents Roger Brewer and Steve Mow Hawaii Department of Health December 2014 1 Key References:


slide-1
SLIDE 1

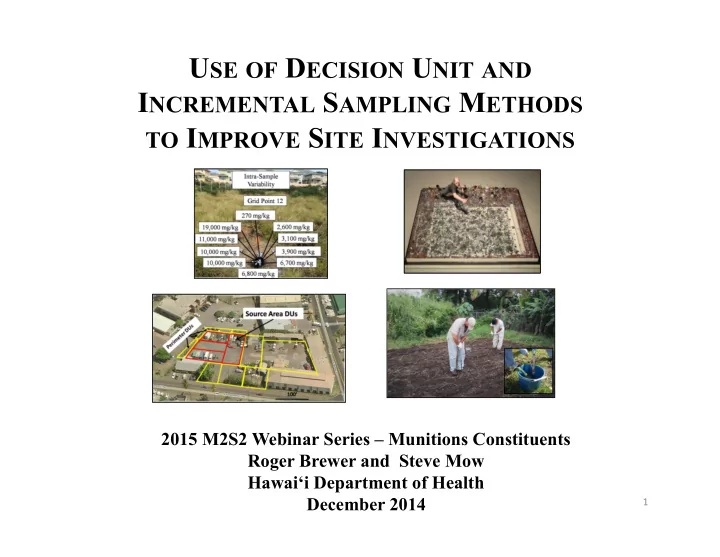
USE OF DECISION UNIT AND INCREMENTAL SAMPLING METHODS

TO IMPROVE SITE INVESTIGATIONS

2015 M2S2 Webinar Series – Munitions Constituents Roger Brewer and Steve Mow Hawai‘i Department of Health December 2014

1 ¡

slide-2
SLIDE 2

Key References:

Incremental Sampling Methodology (ISM) Overview: ITRC, 2012, Incremental Sampling Methodology: Interstate Technology Regulatory Council. Field Implementation (“Multi-increment Sampling”): Technical Guidance Manual (2009 and updates): Hawai‘i Department of Health, HEER Office,

http://www.hawaiidoh.org/

Sampling Theory: Francis Pittard, 1993, Pierre Gy’s Sampling Theory and Sampling Practice, 1993, CRC Press.

2 ¡

slide-3
SLIDE 3

Incremental Sampling Training Courses

  • 1. ITRC: Incremental Sampling Methodology (ISM)

Introduction to basics of incremental sampling

  • 2. Envirostat, Inc.: Chuck Ramsey (www.envirostat.org)

Four-day, detailed introduction to sampling theory and Multi-Increment Sample (“MIS”) site investigations;

  • 3. Francis Pitard Sampling Consultants, LLC: Francis Pitard

(www.fpscsampling.com) Advanced statistical sampling concepts with a focus on

  • ptimization of sampling protocols and mining exploration.
  • 4. Field Practice!

3 ¡

slide-4
SLIDE 4

X: Not detected X: Detected but below screening level X: Detected above screening level Ten gram mass of soil tested from each point

Hypothetical Contaminated Soil Investigation

4 ¡

slide-5
SLIDE 5

Initial Sample Results X: Not detected X: Detected but below 1ppm screening level X: Detected above 1ppm screening level

  • 25 discrete soil samples collected;
  • Soil excavation planned for
  • utlined areas;
  • Confirmation samples to be

collected afterwards. Apparent Isolated Hot Spot Apparent Isolated Cold Spot

Soil Excavation Plan

5 ¡

slide-6
SLIDE 6
  • Multiple failed confirmation

samples;

  • Additional excavation and

resampling required;

  • Significant added time and cost

to project. Confirmation Sample Results : Not detected : Detected but below screening level : Detected above screening level

Failed Excavation Confirmation Samples??

6 ¡

slide-7
SLIDE 7

What’s Going On?

Failed confirmation samples and over excavations Failed in situ remediation and underestimation of mass

  • Initially est benzene mass = 5 tons;
  • 30 tons removed by SVE;
  • Estimated remaining mass = 75 tons

Need for multiple remobilizations and “step-out” investigations

7 ¡

slide-8
SLIDE 8
  • Small-scale, high variability of

contaminant concentrations over a few inches or feet;

  • Concentration reported for any given

discrete sample is largely random;

  • Collecting more discrete samples will

not solve the problem.

PCBs Concentrations in Soil Highly Variable over Short Distances

PCB concentrations highly variable around any given grid point

8 ¡

slide-9
SLIDE 9

Every wonder...

? X ? ? ? “What if I moved my sample point over a few feet? “What if the lab tested a different subsample?

Metals: 0.5-1.0 grams VOCs: 5 grams PCBs, Pesticides, Dioxins, TPH, PAHs: 10-30 grams

9 ¡

slide-10
SLIDE 10

Hawai’i DOH Field Study (2014)

Decision Error Associated with the use of Discrete Soil Sample Data in Environmental Investigations *Part 1: Field Investigation of Discrete Sample Variability (October 2014 - posted) Part 2: Causes and Implications of Small-Scale Discrete Sample Variability (in prep) http://eha-web.doh.hawaii.gov/eha-cma/Org/HEER/ See “What’s New” postings

Detailed discrete sample collection at three sites with known contamination:

  • Arsenic (wastewater and/or sprayed pesticides)
  • Lead (incinerator ash in fill material)
  • PCBs (waste electrical oil)

10 ¡

slide-11
SLIDE 11

PCB Study Site

(small-scale variability probably similar to explosives compounds)

  • 6,000 ft2 area
  • 24 grid points
  • Known PCB contamination

Each Grid Point:

  • Five co-located discrete samples

(“inter-sample” variability)

  • Sixth discrete sample split into ten

subsamples for independent testing (“inter-sample” variability)

50cm

X X X X X

11 ¡

slide-12
SLIDE 12

PCB Concentration Variability in IS Processed Discrete Samples

(Grid Point #12)

980 mg/kg 600 mg/kg 1,100 mg/kg 6,100 mg/kg 370 mg/kg Grid Point 12 Inter-Sample Variability

*Similar ¡variability ¡at ¡lower ¡concentra<ons ¡

12 ¡

slide-13
SLIDE 13

PCB Concentration Variability in Ten Subsamples from One Unprocessed Discrete Sample (Grid Point #12) 10,000 mg/kg 10,000 mg/kg 11,000 mg/kg 19,000 mg/kg 270 mg/kg 2,600 mg/kg 3,100 mg/kg 3,900 mg/kg 6,700 mg/kg 6,800 mg/kg Grid Point 12 Intra-Sample Variability

*Similar ¡variability ¡at ¡lower ¡concentra<ons ¡

13 ¡

slide-14
SLIDE 14

Estimated Average Minimum Variability of Discrete Sample Concentrations Around a Single Grid Point

Arsenic Site: 2X (study max 4X) Lead Site: 8X (study max 40X) PCB Site: 120X (study max 1,200X)

50cm

14 ¡

slide-15
SLIDE 15

Think about the implications…

Dig ¡this ¡spot ¡

  • ut ¡and ¡we’re ¡
  • done. ¡

Fooled by randomness… Step back and look at the bigger picture…

  • Estimating the extent of contamination;
  • Reliability of confirmation samples;
  • Meaning of isolated hot spots & cold spots;
  • Usefulness of isoconcentration maps;
  • Adequacy of laboratory “homogenization”;
  • Estimation of in situ contaminant mass;
  • Data set representativeness for calculation
  • f means and 95% UCLs…

Jackson Pollock X X X X X X X X X X X

15 ¡

slide-16
SLIDE 16

Decision Unit (DU) and Multi-Increment Sampling (MIS)

  • Designed to address small-scale variability/heterogeneity;
  • Used in mining and agricultural industries for decades;
  • Hawai’i began use of DU-MIS approaches in 2004;
  • First guidance published in 2008 (updated 2011, 2015);
  • Similar to ITRC’s “Incremental Sampling Methodology” (ISM)
  • 15,000+ MIS samples collected in Hawai’i to date;
  • Used at close to 100% of sites (surface, subsurface, non-VOCs

and VOCs, etc.);

  • Discrete data sometimes used to assist in designation of DUs.

16 ¡

slide-17
SLIDE 17

Decision Units (DUs)

  • Used to designate scale of decision making up front;
  • “Area and volume of soil that you would send to the lab as a

single sample if you could;”

  • Objective: Estimate mean contaminant concentration within

each designated DU.

Spill ¡Areas ¡ Exposure ¡Areas ¡

17 ¡

slide-18
SLIDE 18

Decision Unit (DU) & Multi-Increment Sample (MIS) Approach DU-­‑1 ¡ DU-­‑2 ¡

DU-­‑3 ¡ DU-­‑4 ¡ Perimeter DUs (8 total) Primary DUs (4 total)

  • Primary Decision Units designated based on:
  • Locations of suspected spill areas,
  • Targeted exposure areas, and/or
  • Resolution desired for potential remediation.
  • Perimeter DUs designated in anticipated clean areas to confirm extent.
  • Similar to placement of discrete sample locations but much higher data quality.
  • Site divided into DUs based on agreed upon exposure areas or

suspect, high-concentration areas (e.g., few 100 to few 1,000 ft2);

  • Objective to estimate average COPC concentration within DU;
  • Perimeter DUs designated to confirm anticipated clean boundaries;
  • Compare to risk-based screening levels.

18 ¡

slide-19
SLIDE 19

Decision Unit (DU) & Multi-Increment Sample MIS Approach

  • Sampling Theory: Very large (1-2+kg) soil sample collected in each

DU from 30 to 100 locations (10-50 grams per “increment”);

  • Systematic random grid easiest to sample (and more representative);
  • Processed at laboratory and tested as single sample;
  • Two replicate MIS samples collected from different locations in select

DUs to test representativeness of original sample;

  • Can be used to estimate 95% UCL if needed.

X: Increment Locations (same for all DUs)

X X X X X X X X X X

X X X X X X X X X X X X X X X X X X X X

X X X X X X X X X X

X X X X X X X X X X

Replicate Data Sample A: 140 mg/kg Sample B: 179 mg/kg Sample C: 135 mg/kg RSD = 16% (good!) 95% UCL: 192 mg/kg

19 ¡

slide-20
SLIDE 20

Field Tools

(soft soil vs gravel, silt vs sand, surface vs subsurface, etc.)

Good ¡ Not ¡good ¡ Increment ¡Shape ¡ Core ¡wedges ¡ Plugs ¡(+/-­‑ ¡COH4) ¡ Subsample ¡cores ¡

20 ¡

slide-21
SLIDE 21

Decision Unit (DU) & Multi-Increment Sample MIS Approach

Confirmation Sample Results : Not detected : Detected but >1ppm screening level : Detected <1ppm screening level

  • Additional testing

required in one area;

  • Remove soil from DUs

that exceed screening level;

  • Collection MIS

confirmation samples.

  • Slightly higher initial field costs (e.g., 700 “soil increments” collected vs 25

discrete samples);

  • Expedites decision making and minimizes need for remobilizations;
  • More defensible data and greater confidence in decision making (e.g., PCBs

do not exceed risk-based screening level for defined exposure areas);

  • More cost and time efficient in the long run.

Addi>onal ¡Tes>ng ¡

21 ¡

slide-22
SLIDE 22

Mixed Source Area & Exposure Area DUs

(former power plant)

100’ Bing ¡

Transformer ¡repair ¡area ¡(PCBs) ¡

For example only

22 ¡

slide-23
SLIDE 23

Former Power Plant Decision Unit Designation

(entire property usually tested)

For example only 100’ ¡

Keep ¡Source ¡Area ¡DUs ¡Small ¡ (few ¡100 ¡to ¡few ¡1,000 ¡K2) ¡ Exposure ¡Area ¡DU ¡s ¡ (e.g., ¡up ¡to ¡10,000K2) ¡

slide-24
SLIDE 24

Former Pesticide Mixing Area

(surrounding field redeveloped for residential homes)

50’ For example only

Suspected Heavy Contamination No Known Spill Areas

24 ¡

slide-25
SLIDE 25

Former Pesticide Mixing Area Decision Unit Designation

Exposure Area DUs: Hypothetical house lots Source Area DUs: Heavy contamination anticipated

50’ Perimeter ¡DUs ¡ For example only

25 ¡

slide-26
SLIDE 26

Source Area & Direct Exposure DU Designation

Smaller Source Area DUs (Triazine Pesticides; leaching hazards) Larger Exposure Area DUs (Arsenic & Dioxins; direct exposure hazards)

26 ¡

slide-27
SLIDE 27

Use of Discrete Data to Assist in DU Designation

(9-acre former pesticide mixing site)

Obviously Contaminated DANGER ZONE! Zone of isolated “cold spots” and “hot spots” reflecting random, small-scale variability above and below screening level. Discrete ¡Sample ¡

Arsenic Isoconcentration Map For example only

Obviously Clean

27 ¡

slide-28
SLIDE 28

One-acre house lots planned Larger Exposure Area DUs Adequate for Apparent Clean Areas Small DUs in Source Area (tens to few hundred cyds)

Use of Discrete Data to Assist in DU Designation

(9-acre former pesticide mixing site)

28 ¡

slide-29
SLIDE 29

Really Big Decision Units!

(400-acre former sugarcane field)

Former ¡ Pes>cide ¡ Mixing ¡Area ¡ (inves>gated ¡ separately) ¡ Large-­‑Scale ¡Screening ¡ ¡(15 ¡DUs) ¡

  • ¡Residual ¡pes>cides ¡in ¡former ¡ag ¡field? ¡
  • ¡MC ¡in ¡former ¡bombing ¡range? ¡

Higher ¡Resolu>on ¡

  • ¡Test ¡hypothe>cal ¡lots; ¡
  • ¡e.g., ¡fiKy-­‑nine ¡random, ¡

5,000 ¡K2 ¡Exposure ¡Area ¡DUs. ¡

29 ¡

slide-30
SLIDE 30

Former ¡Shoo>ng ¡PlaYorms ¡ Lagoon ¡

Upland ¡ Inter>dal ¡ Nearshore ¡

Former Skeet Range

(Source Area Plus Ecological Habitat Based DUs)

Projected shot fallout area

30 ¡

slide-31
SLIDE 31

Former Trap-Skeet Range Decision Unit Designation

Lagoon ¡

Upland ¡ Inter>dal ¡ Nearshore ¡

  • Rectangular DUs are easier to sample;
  • Approximate increment spacing can be calculated based on DU

area and desired number of increments (HDOH TGM Section 4).

Mix of Source Area and Eco- Based DUs

For example only

31 ¡

slide-32
SLIDE 32

Excavation Decision Units

Floor and Sides Tested as Separate DUs

x x x x x x x x x x x x x x x x x x x x x x x x x x x x x x x x

DU-3 DU-1

x x x x x x x x x x x x x x x x x x x x x x x x x x x x x x

Sidewall MI Confirmation Sample Collected from Borings Prior to Excavation

32 ¡

slide-33
SLIDE 33

30yds (10m)

*Unrestricted Use: Maximum DU volume 100-400 cubic yards Restricted Use: Maximum DU volume up to 2,000 cubic yards

Stockpile Decision Units

*Residential Exposure Area DU: 100 cubic yards covers a 5,000 ft2 lot to a depth of six inches

33 ¡

slide-34
SLIDE 34

Subsurface MI Samples From Trenches

Subsurface DU Layer (6”- 1 ft) Surface DU (0-6”) Subsurface DU Layer (1 ft – 3 ft) Floor too mixed to sample

l Soil Increment (elongated for better coverage)

34 ¡

slide-35
SLIDE 35

Collect MI Samples From Target DU Layers

  • ­‑0.5m ¡

0.0m ¡

  • ­‑1m ¡
  • ­‑2m ¡
  • ­‑3m ¡

DU-­‑1 DU-­‑2 DU-­‑3 DU-­‑4

Ideal 30+ Increments per DU Layer Core Increments

  • DU Layers designated based on spill characteristics and to
  • ptimize remedial actions;
  • Core increments for targeted DU Layers subsampled and

combined to prepare a bulk MIS sample.

35 ¡

slide-36
SLIDE 36

Push Rig Collection of Subsurface Increments (300+ feet/day in easy soil)

  • Core increments subsampled using regularly spaced plugs
  • r continuous wedge;
  • Combined into bulk MIS sample for targeted DU layer.

36 ¡

slide-37
SLIDE 37

Single Boring “DUs”

  • Estimate lateral or vertical extent of contamination;
  • Boring divided into targeted intervals (not discrete depths);
  • Entire core interval sent to lab for processing;
  • Presence or absence only;
  • Risk of false negatives.

37 ¡

slide-38
SLIDE 38

Multi-Increment Samples for VOCs

Traditional 5-gram VOC sample

  • Pre-weighed sample jars with methanol provided by

laboratory (1:1 anticipated soil mass to methanol);

  • Five gram plugs from targeted DU (or core) combined and

preserved in methanol in field (alt: individually frozen and sent to lab for combining in methanol);

  • Use Single Ion Methodology (SIM) for lower reporting limits;
  • Allows for testing of very large soil samples for VOCs.

Planned 50- to 150-gram VOC sample

38 ¡

slide-39
SLIDE 39

DU-­‑3 ¡ DU-­‑1 ¡ DU-­‑2 ¡

Former ¡ Sugar ¡Mill ¡ Drainage ¡ Canal ¡

Sediment Sampling

Long, narrow DUs

39 ¡

slide-40
SLIDE 40

DU-MIS Site Investigation Approaches

  • You get what you pay for-
  • Increased time in site history research and

collection of samples;

  • Decreased laboratory costs;
  • More defensible and reliable data for decision

making;

  • Decreased uncertainty in future environmental

liability (reduced future liability);

  • Expedited final cleanup and closure;
  • More cost and time efficient in the long run.

40 ¡

slide-41
SLIDE 41

MIS at Munitions Sites in Hawaii

  • MIS is an effective tool for munitions sites as DUs

can be easily identified by usage (i.e.- target fans, impact areas, bombing targets, berms, etc.).

  • Given the potential size of the DUs, MIS is more

cost effective than discrete sampling.

  • MIS is logistically feasible and easy to do as most

MC contamination is on the surface.

41 ¡

slide-42
SLIDE 42

Lessons Learned from MC Sampling Using MIS

  • MC contamination is not the major risk driver at

impact areas, bombing targets, and maneuver

  • areas. The EHE score consistently outweighs the

HHE score at these types of MMRP sites.

  • MIS is effective at delineating MC contamination

at small arms (pistol, rifle, and skeet) ranges.

42 ¡

slide-43
SLIDE 43

Conclusions Drawn From MC Sampling Efforts

  • Chemical (explosives and metals) contamination is

virtually non-existent at sites where large MEC items (e.g.- 155mm, 105 mm) were found or utilized.

  • Lead is the typical driver of MC risk at small arms

ranges.

  • The degradation of underwater munitions does not

appear to present a chemical hazard to the environment.

  • MC sampling is most effective at small arms ranges

and at depots where munitions are manufactured.

43 ¡