
SLIDE 1
Truck Shipment Example: Periodic
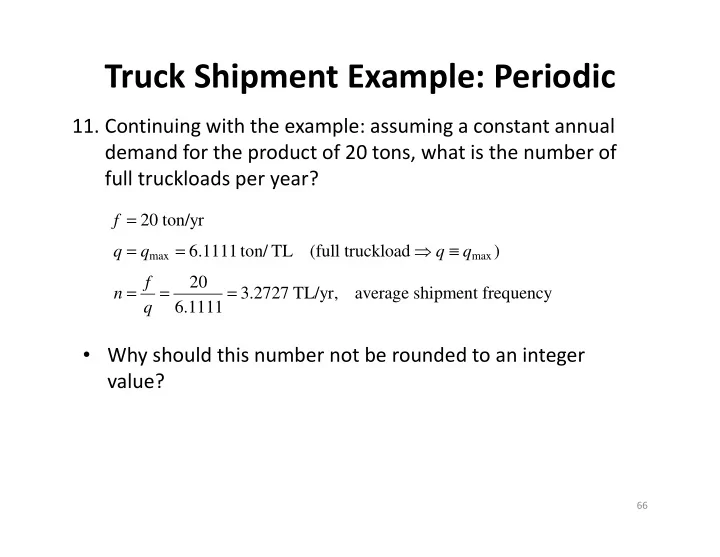
- 11. Continuing with the example: assuming a constant annual
demand for the product of 20 tons, what is the number of full truckloads per year?
max max
20 ton/yr 6.1111 ton/ TL (full truckload ) 20 3.2727 TL/yr, average shipment frequency 6.1111 f q q q q f n q = = = ≡ = = =
- Why should this number not be rounded to an integer
value?
66