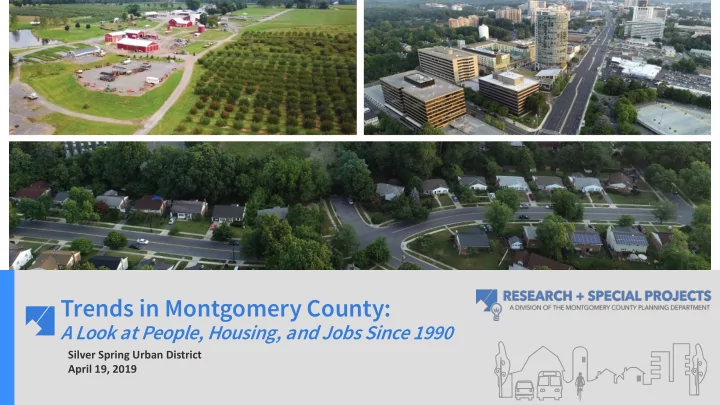

Trends in Montgomery County: A Look at People, Housing, and Jobs Since 1990 Silver Spring Urban District April 19, 2019 Montgomery County Trends Since 1990 1
1964 General Plan “…on Wedges and Corridors” Montgomery County Trends Since 1990 2
1969 General Plan and its Implementation Increase MPDU Law Affordable Housing Protect TDRs Farmland Guide Timely APFO Infrastructure Montgomery County Trends Since 1990 3
Why Update the General Plan? • The last comprehensive update was in 1969 • The county changed from a bedroom community to a major employment center with a diverse population of more than 1 million people • We are entering another era of disruptive technologies and cultural shifts • Now is the time to step back and create a visionary plan for the next 30 years • Change is an opportunity to thrive Montgomery County Trends Since 1990 4
Montgomery County is growing, but more slowly than in past decades. Million-plus population since 2012 Decreasing gain and rate of growth since 1990 2017: 1,058,800 1990: 765,500 +293,300 38% population increase since 1990 Largest county in Maryland Montgomery County Trends Since 1990 5
Most of the growth has occurred in outer lying areas and along transit corridors. Montgomery County Trends Since 1990 6
Immigration contributes to significant diversity. Greater racial & ethnic diversity Increasing foreign-born population People of Color: 579,397 (56%) 2016: 344,645 1990: 141,166 +203,500 (59%) Up from 19% in 1990 to 33% in 2016 Majority from Latin America (37%) & Asia (37%) 1) El Salvador (47,792, 14%) 2) China (28,243, 8%) 3) India (24,306, 7%) Montgomery County Trends Since 1990 7
Racial and ethnic diversity is increasingly distributed across the county. Montgomery County Trends Since 1990 8
Driven by the baby boomers, the population is aging. Increased median age from 33.9 years in 1990 to 39 years in 2016 Montgomery County Trends Since 1990 9
Montgomery County remains highly educated. Educational Attainment of Adults Age 25+ Highly educated adult residents: 59% have BA degrees compared to 50% in region Concentration of advanced degrees 5 th in US High levels of educational attainment correlated with management, business and science jobs and high median income households Montgomery County Trends Since 1990 10
Increases in housing prices have outpaced income growth. Average Sale Price Average Rent PSF Median Income All dollar values adjusted for inflation Montgomery County Trends Since 1990 11
The top two industries employed 40% of residents in 2016, compared to 33% in 1990. Resident employment, Education, health, social services by industry Professional, scientific, management, administrative, waste mgmt. services 600,000 residents in the workforce 2 nd largest workforce in Public administration the region Arts, entertainment, recreation, accommodation, food services Retail FIRE Other Services Construction Information Transportation, warehousing, utilities Montgomery County Trends Since 1990 12
Most residents live and work in Montgomery County. 90% 78% 80% 75% 70% 61% 60% 60% 58% 60% 54% 50% 50% 50% 43% 43% 40% 40% 36% 40% 34% 32% 30% 20% 10% 0% Montgomery Frederick Prince Howard District of Fairfax County Loudoun Arlington County County George's County Columbia County County County 1990 2016 Montgomery County Trends Since 1990 13 13
The number of QCEW jobs in the county increased by 21% since 1990 to 460,0000 in 2016. The sizes of the sectors have remained stable over time, according to data in the Quarterly Census of Employment and Wages (QCEW) Professional, scientific and technical services is the largest at 65,000 81% Private sector Health care and social assistance grew the fastest at 111% 10% Federal government Retail and construction jobs experience greatest declines 9% Local government Montgomery County Trends Since 1990 14
Employment forecast has declined over time. Comparison of select forecasts to actual employment, 1994-2017 750,000 700,000 650,000 600,000 550,000 500,000 450,000 400,000 350,000 300,000 250,000 1985 1990 1995 2000 2005 2010 2015 2018 2020 2025 2030 2035 2040 2045 QCEW 5.1 ('94) 6.4a ('04) 7a ('06) 7.1 ('08) 8.3 ('14) 9.1 CoG Estimated Total Jobs Montgomery County Trends Since 1990 15 15
THANK YOU! Gwen Wright, Planning Director gwen.wright@montgomeryplanning.org Casey Anderson, Planning Board Chair Casey.Anderson@montgomeryplanning.org Carrie McCarthy Caroline.mccarthy@montgomeryplanning.org Follow Planning: @montgomeryplans Facebook: facebook.com/montgomeryplanning Montgomery County Trends Since 1990 16
Recommend
More recommend