Three measures of subjective social status Subjective measures of - - PDF document

three measures of subjective social status subjective
SMART_READER_LITE
LIVE PREVIEW

Three measures of subjective social status Subjective measures of - - PDF document

Three measures of subjective social status Subjective measures of social Centers (1949): Subjective 'Social Class (lower status: validation class, working class, upper working class, middle class, upper middle class, upper class).


slide-1
SLIDE 1

Subjective social status in ISSP 1

Subjective measures of social status: validation

Harry B.G. Ganzeboom Free University Amsterdam ISSP, Taipei, April 29 2007

Subjective social status in ISSP 2

Three measures of subjective social status

  • Centers (1949): Subjective 'Social Class (lower

class, working class, upper working class, middle class, upper middle class, upper class).

  • Diagram question: "Where do you belong in

diagram?" (1 – top … 6 – bottom).

  • Top-bottom ladder: "Where would you put

yourself on this scale?" (1 – top … 10 – bottom).

Subjective social status in ISSP 3

Questions

  • Do they measure the same thing (validity)?
  • Do they measure that same thing with equal

reliability?

  • Do we need three indicators: what is that

good for?

Subjective social status in ISSP 4

Research design

  • Compare distributions across country and

time:

– R2 by country – Change in means over time

  • Missing value patterns
  • Reliability / factoi analysis
  • Validity analysis in structural model

Subjective social status in ISSP 5
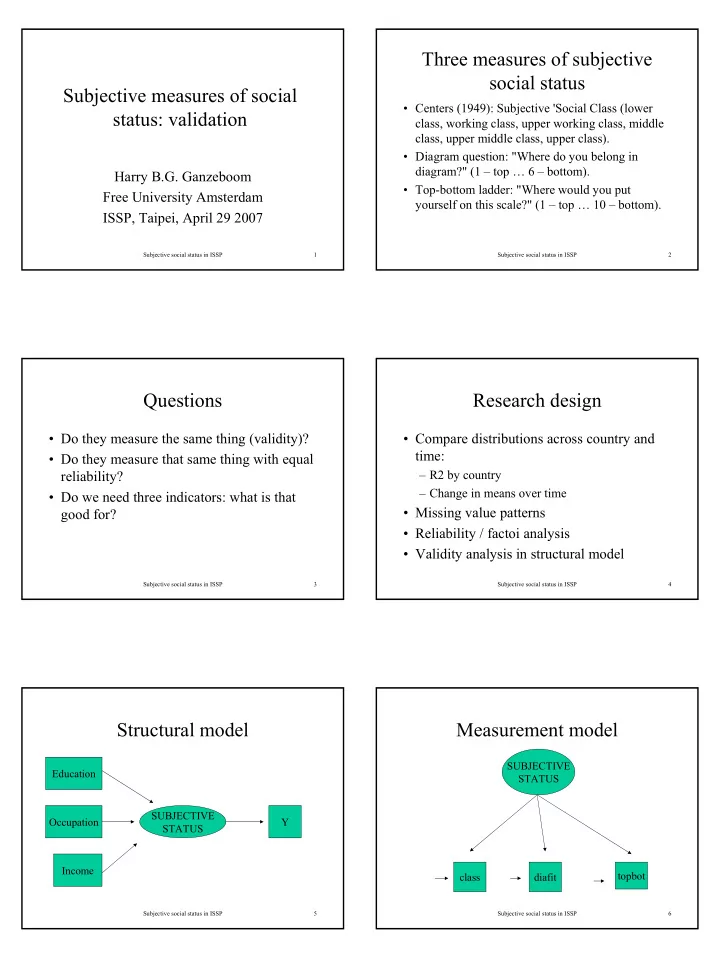
Structural model

Education Occupation Income SUBJECTIVE STATUS Y

Subjective social status in ISSP 6

Measurement model

SUBJECTIVE STATUS class diafit topbot

slide-2
SLIDE 2

Subjective social status in ISSP 7

Data (from INEQ modules)

  • Distributional analysis: all available data.
  • Validation: only countries/wave in which all

three measures are available

– Pooled – Per country/wave

Subjective social status in ISSP 8

Missing values analysis

3.3 6.8 4.5 1999 3.2 6.7 10.6 1992 3.6 2.9 1987 TOPBOT DIAFIT1 CLASS

Subjective social status in ISSP 9

Correlations – all data

Correlations 1 .487 .651 . .000 .000 70613 56537 37996 .487 1 .508 .000 . .000 56537 58141 36925 .651 .508 1 .000 .000 . 37996 36925 38880 Pearson Correlation

  • Sig. (2-tailed)

N Pearson Correlation

  • Sig. (2-tailed)

N Pearson Correlation

  • Sig. (2-tailed)

N TOPBOT CLASS DIAFIT1 TOPBOT CLASS DIAFIT1

Subjective social status in ISSP 10

Correlations -- listwise

Correlations 1 .511 .650 . .000 .000 36145 36145 36145 .511 1 .510 .000 . .000 36145 36145 36145 .650 .510 1 .000 .000 . 36145 36145 36145 Pearson Correlation

  • Sig. (2-tailed)

N Pearson Correlation

  • Sig. (2-tailed)

N Pearson Correlation

  • Sig. (2-tailed)

N TOPBOT CLASS DIAFIT1 TOPBOT CLASS DIAFIT1

Subjective social status in ISSP 11

Reliability

  • Alpha:

0.767

  • Without CLASS:

0.744

  • Without DIAFIT1: 0.675
  • Without TOPBOT: 0.630

Subjective social status in ISSP 12

Differences and trends

  • TOPBOT 18.7%

wave: ns

  • DIAFIT1 14.2%

wave: t = -2.1

  • CLASS

13.6% wave: t = +2.5

slide-3
SLIDE 3

Subjective social status in ISSP 13

Predicting TOLARGE

[1] [2]

  • CLASS

.139 .079

  • DIAFIT1

.144 .104

  • TOPBOT

.089 .072

  • SUBJPOS

.214 .214

(Standardized regression coefficients, controlled for country and wave differences, [1]: bivariate, [2] multiple.)

Subjective social status in ISSP 14

Correlations with objective status

.184 .141 .130 TOPBOT .198 .158 .161 DIAFIT1 .145 .226 .231 CLASS INCOME OCCUP- ATION EDUC- ATION

Subjective social status in ISSP 15

Intervening variable SES TOLARGE?

.218 .034 Controlling SUBJPOS .167 .062 Controlling TOPBOT .181 .061 Controlling DIAFIT1 .149 .046 Controlling CLASS .101 Total effect

Subjective social status in ISSP 16

Observe

  • Effect of subjective position is considerably

stronger than of objective position.

  • Three indicators are needed to bring out the

intervening effect.