
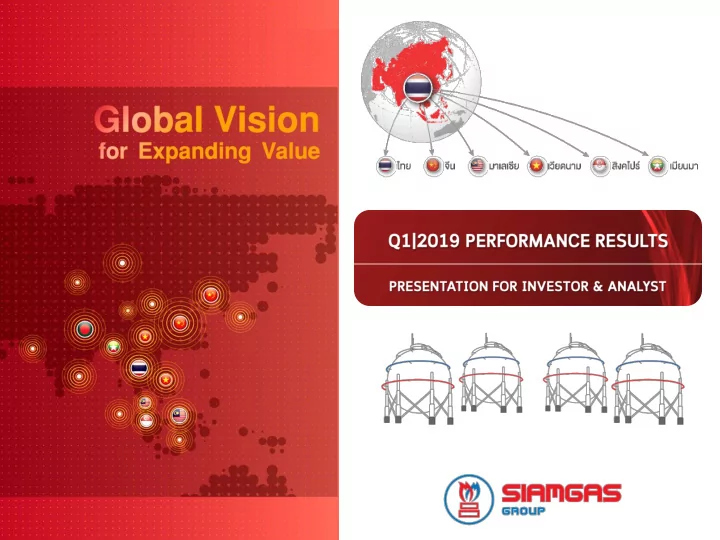
SLIDE 1
This presentation may include information which is forward-looking in - - PowerPoint PPT Presentation
The information contained in this presentation is for information purposes only and does not constitute an offer or invitation to sell or the solicitation of an offer or invitation to purchase or subscribe for share in Siamgas and Petrochemicals
The information contained in this presentation is for information purposes only and does not constitute an offer or invitation to sell or the solicitation of an offer or invitation to purchase or subscribe for share in Siamgas and Petrochemicals Public Company Limited (“SGP” and shares in SGP, “shares”) in any jurisdiction or should it or any part of it form the basis of, or be relied upon in any connection with, any contract or commitment whatsoever. This presentation may include information which is forward-looking in nature. Forward- looking information involve known and unknown risks, uncertainties and other factors which may impact on the actual outcomes, including economic conditions in the markets in which SGP operates and general achievement of SGP business forecasts, which will cause the actual results, performance or achievements of SGP to differ, perhaps materially, from the results, performance or achievements expressed or implied in this presentation. This presentation has been prepared by the SGP. The information in this presentation has not been independently verified. No presentation, warranty, express or implied, is made as to, and no reliance should be placed on, the fairness, accuracy, completeness or correctness of the information and opinions in this presentation. None of the SGP or any
representatives, shall have any liability (in negligence or otherwise) for any loss howsoever arising from any use of the presentation or its contents or otherwise arising in connection with this presentation. This presentation is made, furnished and distributed for information purposes only. No part of this presentation shall be relied upon directly or indirectly for any investment decision-making or for any other purposes. This presentation and all other information, materials or documents provided in connection therewith, shall not, either in whole or in part, be reproduced, redistributed
laws.
Latest book closing : On 8 MAR 2019
Founded the company Business acquisition Uniquegas Listed in Setup | Cylinder Manufacture Acquire | Ethanol Business Business acquisition Vietnam | Supergas Singapore | Singgas China | Sinosiam Setup | Trading Business in Singapore Business acquisition China | Sogel Business acquisition Vietnam | Citygas N. Malaysia | Mygaz Founded Marine & land logistic Invest in 230 MW.Power Plant In Myanmar
Invest in 10 MW. Power Plant and transmission line in Myanmar
FILLING PLANT & AUTOGAS STATION Company Filling Plants x 43 Agent Filling Plants x 144 Company Autogas Stations x 44 Agent Autogas Stations x 521
SGP GROUP 24.6%
OTHERS 75.5%
MKT SHARE Q1/2019
610 619 616 594 153 149 145 1,484 1,491 1,534 1,570 394 396 386 2,094 2,110 2,151 2,164 547 545 531 2015 2016 2017 2018 1Q'18 4Q'18 1Q'19 SGP Group Others Total Cooking
SGP GROUP 27.3%
OTHERS 72.7%
MKT SHARE Q1/2019
+1.4% +0.8%
+1.9%
+0.6%
292 245 230 228 59 56 52 1,439 1,221 1,089 942 244 229 213 1,731 1,466 1,319 1,170 303 285 265 2015 2016 2017 2018 1Q'18 4Q'18 1Q'19 SGP Group Others Total Automotive
22%
SGP GROUP 19.5%
OTHERS 80.5%
MKT SHARE Q1/2019
* 10 company
137 142 155 162 41 41 40 448 459 483 515 129 131 126 584 600 638 677 170 172 166 2015 2016 2017 2018 1Q'18 4Q'18 1Q'19 SGP Group Others Total Industrial
17%
SGP GROUP 24.1%
OTHERS 75.9%
MKT SHARE Q1/2019
+2.8% +3.7% +6.3% +9.3%
+6.0% +4.4%
54.9 55.5 52.0 53.1 50.9 46.9 48.7 51.4 55.2 57.6 62.6 64.2 69.1 65.7 66.7 71.8 77.0 75.9 75.0 73.8 79.1 80.6 66.0 57.7 60.2 64.4 67.0 71.6 70.3 61.5
1 2 3 4 1 2 3 4
2010 2011 2012 2013 2014 2015 2016 2017 2018
2008 2009 2010 2011 2012 2013 2014 2015 2016 2017 2018 0.15 0.20 0.20 0.15 0.15 0.10 0.15 0.20 0.15 0.50 0.25 0.25 0.30 0.30 0.30 0.25 0.50 0.20 0.30 0.35 1.00 0.20
SGP split par from Bt1.00 to Bt 0.50 in May 2018