
SLIDE 1
1
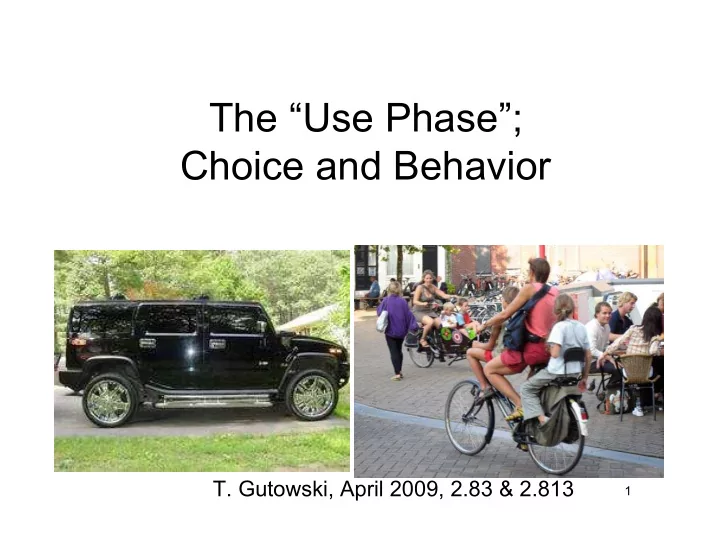
The “Use Phase”; Choice and Behavior
- T. Gutowski, April 2009, 2.83 & 2.813
The Use Phase; Choice and Behavior T. Gutowski, April 2009, 2.83 - - PowerPoint PPT Presentation
The Use Phase; Choice and Behavior T. Gutowski, April 2009, 2.83 & 2.813 1 The use phase often dominates 87% 87% 79% Results for the automobile 2 Source: Sullivan & Cobas-Flores (2001), Cheah Full Vehicle LCAs: A Review ,
1
2
Source: Sullivan & Cobas-Flores (2001), Full Vehicle LCAs: A Review, SAE 2001-01-3725
87% 87% 79%
Cheah
3
4
5
Mean Energy
0.0 10.0 20.0 30.0 40.0 50.0 60.0 Food, Diet, Alcohol Housing, Furniture, Maintenance Home Utilities, Fuel Apparel, Services Transportation Services, Personal Insurance and Investment Tax, Government Services Category Energy (MJ/$)
6
Mean CO2
0.00 1.00 2.00 3.00 4.00 5.00 6.00 7.00 8.00 Food, Diet, Alcohol Housing, Furniture, Maintenance Home Utilities, Fuel Apparel, Services Transportation Services, Personal Insurance and Investment Tax, Government Services Category CO2 (KG/$)
7
Mean Toxics
0.00 0.50 1.00 1.50 2.00 2.50 3.00 3.50 4.00 Food, Diet, Alcohol Housing, Furniture, Maintenance Home Utilities, Fuel Apparel, Services Transportation Services, Personal Insurance and Investment Tax, Government Services Category Toxics (G/$)
8
Fay & Golomb
9
http://strickland.ca/efficiency.html
10
http://strickland.ca/efficiency.html
11
12
13
14
15
Source: Pinkus and Wilcock, The Role of Tribology in Energy Conservation, Lubrication Engineering, 34 (11),
16
Source: Beaton et al (1995), On-Road vehicle emissions, Science 268, 991-993
17
Vehicle weight-fuel consumption relationship for US vehicles
y = 0.0059x + 1.2346 R2 = 0.7303
0.0 5.0 10.0 15.0 20.0 25.0 500 1,000 1,500 2,000 2,500 3,000 Curb weight (kg) Fuel consumption (L/100km)
Cheah
18
50 Honda Civic 28 55 56 28 MPG Regular Accord Toyota Prius Honda Insight Honda Accord 2006 hybrids
Cheah
19
The New York Times March 30, 2006
20 Source: FHWA, US DOT
Average annual miles traveled per car in the US
8,000 8,500 9,000 9,500 10,000 10,500 11,000 11,500 12,000 12,500 13,000 1975 1980 1985 1990 1995 2000
21
1000 2000 3000 4000 5000 1 2 3 4 5 6 7 8 1930 1940 1950 1960 1970 1980 1990 2000 2010
Year
FIGURE 9: Motor Vehicle Travel ( Q) and the Efficiency
e) (US) g
Efficiency Quantity
Dahmus
22
23
20 40 60 80 1950 1960 1970 1980 1990 2000 2010
Year
FIGURE A8: Resources Consumed ( R) in Passenger Air Travel (US airlines)
f
Dahmus
24
25
Lee, Waitz
26
Babikain, Waitz
27
28
(according to Whitt & Wilson bicycling on the level is about 4 times more energy efficient than walking)
29
30
31
Fay & Golomb
32
33
34
35
http://www.engineeringtoolbox.com/heat-loss-buildings-d_113.html http://hyperphysics.phy-astr.gsu.edu/Hbase/thermo/heatloss.html
37
http://hyperphysics.phy-astr.gsu.edu/Hbase/thermo/heatloss.html
38
39
40
41
42
43
44
Fay & Golomb
45
Idle (Watts) In Use (Watts) Lights # of bulbs watts per bulb Fixture 1, 4 x 40 watt bulbs 4 40 160 Fixture 2, 2 x 60 watt bulbs 2 60 120 Fixture 3, 2 x 40 watt bulbs 2 40 80 Fixture 4, 1 x 60 watt bulb 1 60 60 Fixture 5, 1 x 11 watt bulb 1 11 11 Fixture 6, 1 x 25 watt bulb 1 25 25 Fans, etc Portable Air Cleaner Electric 50 Desk Fan 30 Floor Fan 30 Cleaning Clotheswasher 269.2 Clothes dryer 4500 Iron 1100 Vaccuum 650 Hand-Held Electric Vacuum 300 Hygiene Men's Shaver 1.4 15 Women's Shaver 1.4 15 Curling Iron 25 Hair Dryer 710 Hand Held Massager 15 Heating Pads 60 Default Values*
46
Kitchen Can Opener 100 Blender 300 Juicer 125 Hand Mixers 150 Stand Mixers 100 Auto Coffee Maker 70 1500 Espresso Maker 360 Hot Plate 1250 Electric Stove Burner 1250 Electric Kettle 1500 Microwave 3.1 1500 Air Corn Popper 1400 Hot Oil Corn Popper 575 Slow Cooker 200 Electric grill 1800 Waffle Iron/Sandwhich Grill 1200 Dishwasher 694 Refrigerator 6.1 571 Entertainment Audio Stand-alone Boom Box 2.2 4.8 Mini-System 9.4 34 Clock Radio 1.7 8.3
47
Audio Components (add together as appropriate) Amplifier 1.4 31 Cassette Deck 2.7 2 CD Player 3.1 16 DVD Player 4.5 20 Equalizer 3.1 52 Power Speaker 4.6 5.8 Preamp/Tuner 2.4 18 Rack 3.2 6.2 Receiver 1.8 6.7 Tuner 2 6.2 Video Games 2 20 Color TV 4 77 Projection Color TV 2.2 150 Satellite Earth Station 14.9 15 Cable Boxes 11.6 20 Rechargeable Toy/Game 2.2 Miscellaneous Cell Phone Charger 8.6 8.6 Cordless Phone 1.1 1.1 Cordless Power Tool 0.63 0.63 Multi-Purpose Battery Charger 0.2 0.2 * Values from LBNL
48
49
Allwood
50
Allwood
51
52
53
54
55
100 200 300 400 500 1950 1960 1970 1980 1990 2000 2010 YearFIGURE A10: Resources Consumed ( R) in Refrigeration h
Time Period Average Annual _e/e Average Annual _Q/Q 1960-2006
2.5% 1960-1969
3.6% 1970-1979
2.9% 1980-1989 1.7% 2.3% 1990-1999 4.6% 1.9% 2000-2006 3.7% 2.5% Activity Refrigeration
1960 -1969 1970 -1979 1980 -1989 1990 -1999
0% 1% 2% 3% 4%Average Annual _e/e
FIGURE 18: Average Annual _Q/Q versus Average Annual _ e/e for Refrigeration (US data) h
1960 -2006 2000 -2006
Dahmus
56
57
Luckyanova
58
Luckyanova
59
60
61
Luckyanova
63
Boustani
64
Boustani
65
Boustani
66
67
68
69
70
71
72
73
x
Apparent error In label
COT= Cost of transportation
74
64 21 Methanol Smil 40-41 Crude oil 75 42 Heating Oil US Grid η=1/3 Hydrogen Methane Octane Carbon Chemical (ideal) Per kWh electricity= 114 50 46 33 Calculated Max Exergy MJ/kg* 667g/kWh 56 68 112 CO2 generated gCO2/MJ Per MJ Fuel= Hydrogen Methane Nat Gas Gasoline Anthracite Steam coal Fuel (LHV) 62 gCO2/MJ 120 50 29.3-35.7 41.7-44.1 29-31 19-21 Lower Heat Combustion MJ/kg DOE EIA Smil Smil Smil Smil Ref
75
76
77
78
Energy Information Administration International Energy Annual 2006 Table Posted: December 19, 2008 Next Update: August 2009 Table Notes and Sources
E.1c World Per Capita Total Primary Energy Consumption,1980-2006
(Million Btu) Region/Country 1980 1981 1982 1983 1984 1985 Bermuda 145.0 124.9 131.7 138.8 134.7 131.9 Canada 394.2 385.1 365.3 361.0 380.7 391.3 Greenland 1.1 1.1 0.5 0.5 0.5 NA Mexico 54.5 58.9 60.5 55.4 55.7 57.6 Saint Pierre and Miquelon 366.4 367.0 336.3 363.0 354.2 310.9 United States 343.1 331.2 315.1 311.7 324.6 320.8 North America 285.4 276.6 263.4 259.0 268.9 266.8 Antarctica NA NA NA NA NA NA Antigua and Barbuda 87.3 77.8 104.5 63.4 73.3 72.1 Argentina 57.8 55.3 57.0 56.8 60.8 57.4 Aruba
Bahamas, The 285.3 294.6 246.3 180.9 159.7 141.3 Barbados 57.4 60.6 60.2 63.3 60.7 66.6 Belize 22.8 20.2 18.5 18.0 19.3 18.7 Bolivia 13.7 15.0 13.1 13.2 12.5 11.3 Brazil 32.7 30.9 30.6 29.9 32.1 33.5 Cayman Islands 84.5 86.4 83.5 78.9 77.5 76.4 Chile 38.5 37.2 32.5 32.5 33.0 33.1
79