SLIDE 1
SLIDE 2
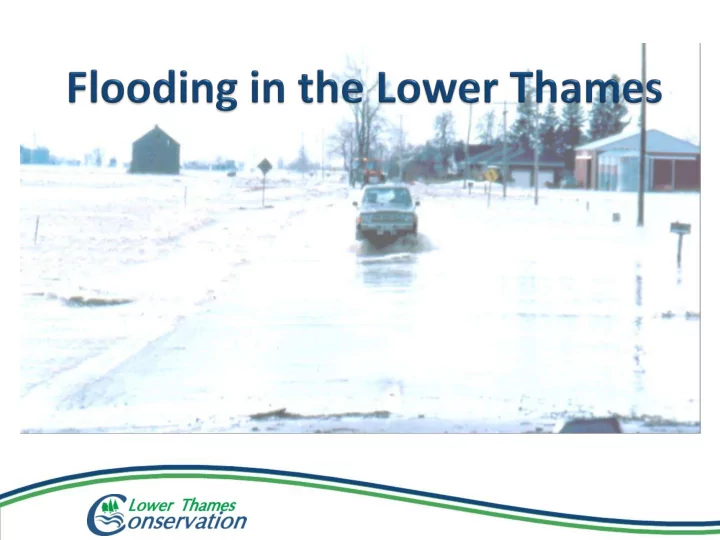
The Thames River is the primary focus of flooding but some areas are prone to Great Lakes Flooding as well.
SLIDE 3 Maintain a watershed
monitoring network in
issuance of flood messages to the Municipalities and
agencies.
Provide other technical advice of flood related matters
to the Municipalities and other selected agencies.
SLIDE 4
Undertake certain designated emergency measures to
alleviate flooding beyond the means of a single Municipality.
Liaise between the Municipalities and the Province on
matters relating to the procurement of provincial assistance during a flood emergency.
SLIDE 5 Has experienced a
long history of flooding
The most probable
flood event is one that originates from rain and snowmelt.
The resulting flooding
can be aggravated in some areas due to ice jamming. Severe floods have
1948, 1968, 1977, 1979 and 1985.
SLIDE 6
5825 km2 2nd largest
watershed in Ontario
3482 km2 in
the UTRCA
3275 km2 in
the LTVCA
SLIDE 7
Dams
Fanshawe Wildwood Pittock Mitchell R. T. Orr
SLIDE 8 Flooding caused by rainfall in the watershed of the
Lower Thames
During the same first day of runoff, the smaller creeks
and drains will enter the lower Thames River
Need extreme rainfall event(s) (multiple days with rain)
- r heavy rains on top of already saturated soil
conditions such as those typical in the spring
Consecutive flooding on the tributaries of the Thames
River such as McGregor Creek
SLIDE 9
Caused by heavy rainfall in the Upper Thames
watershed
Causes high flows in the Upper Thames that then pass
downstream
Can back up local tributaries causing further flooding
SLIDE 10
On the first day, flows converge at the forks of the Thames River in London. While in the lower Thames, flows from the tributaries enter somewhat in parallel.
SLIDE 11
SLIDE 12
Thames Street in Chatham The 1939 flood event became the Regulation event for Floodplain Management in the Thames River basin.
SLIDE 13 Water passing over Grande River Line in Dover Twp. Estimated 170 m3/s passed over Grande River Line, an equal amount passed
Line, and 450 m3/s passed the ice jam.
SLIDE 14
Looking south towards the Thames River. Thamesville has no flood control infrastructure against flooding and back up flooding from the Thames River.
SLIDE 15
Runoff flooding on Indian and McGregor Creeks
is caused by heavy rainfall (and sometimes snowmelt) on the watersheds.
Backup flooding from the Thames River occurs
when the water from upriver finally makes its way to Chatham and backs up that same system into the low lying South Chatham area.
SLIDE 16 Queen St. and
Indian Creek Road
along the Indian Creek watershed
1985 flood
SLIDE 17 From 5th St. Bridge
- Typical spring flooding
- April 14th, 2013
SLIDE 18
230 km2
drainage area.
Combined
watershed of Indian Creek, McGregor Creek and the Wolfe Drain makes up approximately 10% of Chatham-Kent.
SLIDE 19
Composed of a Diversion Channel and Dam, and a
Backwater Dam and Pumping Station at the outlet of McGregor's Creek into the Thames River.
Environmental Assessment process began in 1984. Construction from 1989 to 1992. Total project cost $16.5 million dollars. Estimated $30 million worth of flood prevention
benefits to over 2,000 homes and businesses.
A typical operation of just the Diversion in 2013 was
estimated to have prevented $340,000 in damage.
SLIDE 20
SLIDE 21 Channel is 3.3 kilometres
long, 6 metres deep with a top width of 50 metres.
The Diversion Channel,
with associated dams and bridges, was constructed
year period starting in 1989 and cost approximately 11 million dollars.
SLIDE 22
SLIDE 23
Dam has 4 gates each measuring 5 x 3 m. Closed only when water in the Thames River is high. Pumping is required when the dam is closed in order
to drain water from flows coming down through the McGregor and Indian Creek watersheds.
Has a pumping capacity of 8.5 cubic metres per
second.
Dam and Pumping Station were constructed in 1991
at a cost of $3 million.
SLIDE 24
SLIDE 25
SLIDE 26
SLIDE 27
But when they do overtop, or breach, flooding can spread a fair distance from the Thames River, impacting several thousand rural residences and agricultural lands.
SLIDE 28
SLIDE 29
SLIDE 30
1979 – 9,000 Acres, 100 Homes 1981 – 4,500 Acres, 200 Homes 1984 – 2,000 Acres, 200 Homes 1985 – 14,000 Acres, 380 Homes
SLIDE 31