
SLIDE 1
International Quinoa Conference 2016: Quinoa for Future Food and Nutrition Security in Marginal Environments
Dubai, 6-8 December 2016 www.quinoaconference.com
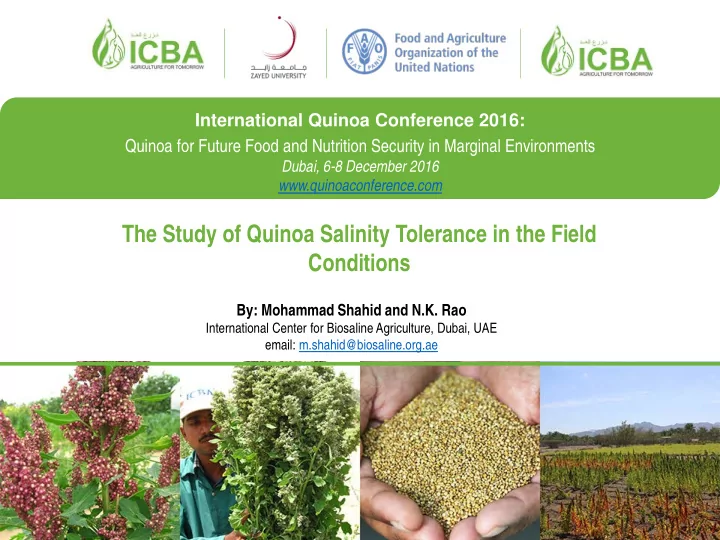
The Study of Quinoa Salinity Tolerance in the Field Conditions
By: Mohammad Shahid and N.K. Rao
International Center for Biosaline Agriculture, Dubai, UAE email: m.shahid@biosaline.org.ae