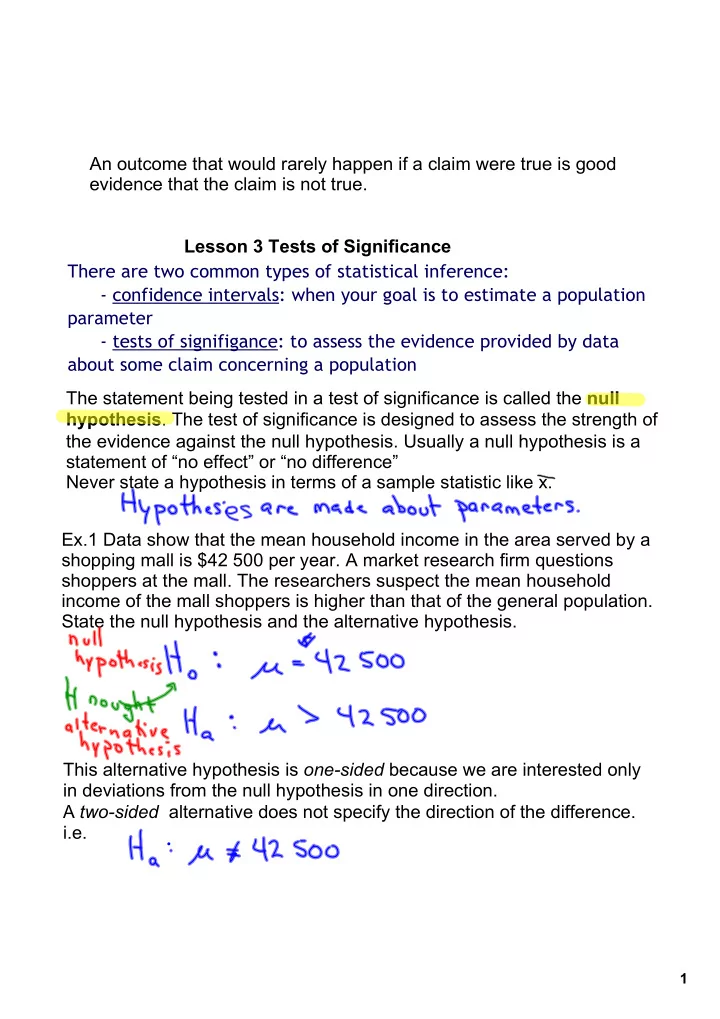
the statement being tested in a test of significance is
play

The statement being tested in a test of significance is called the - PDF document

An outcome that would rarely happen if a claim were true is good evidence that the claim is not true. Lesson 3 Tests of Significance There are two common types of statistical inference: confidence intervals : when your goal is to estimate a


  1. An outcome that would rarely happen if a claim were true is good evidence that the claim is not true. Lesson 3 Tests of Significance There are two common types of statistical inference: ‐ confidence intervals : when your goal is to estimate a population parameter ‐ tests of signifigance : to assess the evidence provided by data about some claim concerning a population The statement being tested in a test of significance is called the null hypothesis . The test of significance is designed to assess the strength of the evidence against the null hypothesis. Usually a null hypothesis is a statement of “no effect” or “no difference” Never state a hypothesis in terms of a sample statistic like x. Ex.1 Data show that the mean household income in the area served by a shopping mall is $42 500 per year. A market research firm questions shoppers at the mall. The researchers suspect the mean household income of the mall shoppers is higher than that of the general population. State the null hypothesis and the alternative hypothesis. This alternative hypothesis is one­sided because we are interested only in deviations from the null hypothesis in one direction. A two­sided alternative does not specify the direction of the difference. i.e. 1

  2. Keep in mind: Significant in the statistical sense means “not likely to happen just by chance”. A test of signifigance assesses the evidence against the null hypothesis by giving a probability, the P‐value. If the sample statistic falls far from the value of the population parameter suggested by the null hypothesis in the direction specified by the alternative hypothesis, it is good evidence against H 0 and in favour of H a . The P‐ value describes how strong the evidence is because it is the probability of getting the outcome. Ex. 1 We can continue our household income example knowing that σ x =5000 and our sample size is 100. If the research firm found the mean income to be $43000 for their sample, is our null hypothesis correct? 2

  3. If we want to go one step further we can give a decisive value of P, called the significance level . We write it as α . i.e. if we choose α =0.05, we are requiring that the data give evidence against H 0 so strong that it would happen no more that 5% of the time (1 in 20 samples in the long run). Ex. 2 The Census Bureau reports that households spend on average 31% of their total spending on housing. A homebuilders association believes that this average is lower in their area. They conduct a survey of 40 households. The population standard deviation is σ = 9.6%. a) What are the null and alternative hypotheses? b) Sketch the curve of the density curve of the sampling distribution if the null hypothesis is true. c) Suppose the study finds x = 30.2% for the 40 households. Mark this on your sketch. d) Suppose instead the study finds x = 27.6%. Mark this on your sketch. e) Calculate the P‐values for both xs. f) Is the result x = 27.6% statistically signifigant at the α = 0.05 level? Is it signifigant at the α = 0.01 level? Read through examples 10.13 and 10.14 starting on page 573. Work on: p. 569 #10.33, 10.35, 10.39, 10.40, 10.42, 10.43 For tonight: read pages 586 ­ 591 Do #10.57 ­ 10.59, 10.61 3

  4. To test the claim about an unknown population parameter: 1. Identify the population of interest and the parameter you want to draw conclusions about. State the null and alternative hypothesis in words and symbols. 2. Choose the appropriate inference procedure. Verify the conditions for using the selected procedure. 3. If the conditions are met, carry out the inference procedure. ­ Calculate the test statistic ­ Find the P­value 4. Interpret your results in the context of the problem. z Test for a population mean To test the hypothesis H 0 : μ=μ 0 based on an SRS of size n from a population with unknown mean μ and known standard deviation σ, compute the one-sample z statistic In terms of a variable Z having the standard normal distribution, the P‐value for a test of H 0 against H a : μ>μ 0 is P(Z≥z) H a : μ<μ 0 is P(Z≤z) H a : μ≠μ 0 is 2P(Z≥ |z| ) These P‐values are exact if the population distribution is normal and are approximately correct for large n in other cases. Read through examples 10.13 and 10.14 starting on page 573. Work on: p. 569 #10.33, 10.35, 10.39, 10.40, 10.42, 10.43 For tonight: read pages 586 ­ 591 Do #10.57 ­ 10.59, 10.61 4

Download Presentation
Download Policy: The content available on the website is offered to you 'AS IS' for your personal information and use only. It cannot be commercialized, licensed, or distributed on other websites without prior consent from the author. To download a presentation, simply click this link. If you encounter any difficulties during the download process, it's possible that the publisher has removed the file from their server.

Recommend


More recommend