
SLIDE 1
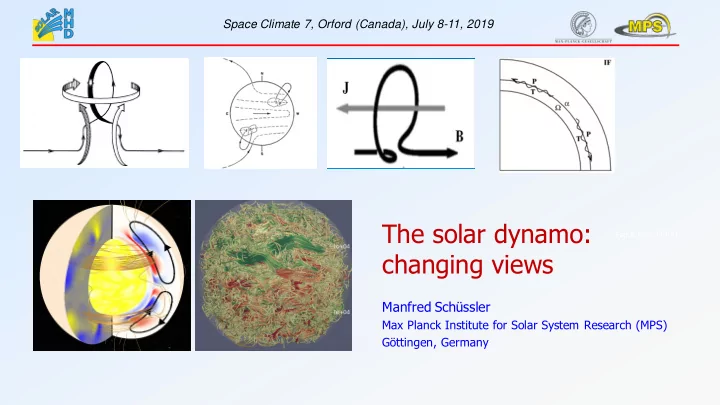
The solar dynamo: changing views
Manfred Schüssler
Max Planck Institute for Solar System Research (MPS) Göttingen, Germany Space Climate 7, Orford (Canada), July 8-11, 2019
Fan & Fang (2014)
The solar dynamo: Fan & Fang (2014) changing views Manfred - - PowerPoint PPT Presentation
Space Climate 7, Orford (Canada), July 8-11, 2019 The solar dynamo: Fan & Fang (2014) changing views Manfred Schssler Max Planck Institute for Solar System Research (MPS) Gttingen, Germany Outline A brief history Challenges to
Manfred Schüssler
Max Planck Institute for Solar System Research (MPS) Göttingen, Germany Space Climate 7, Orford (Canada), July 8-11, 2019
Fan & Fang (2014)
George Ellery Hale
ApJ 49, 153 (1919) The 22-year magnetic cycle Tilt angle of sunspot groups as f()
„How could a rotating body such as the sun become a magnet?″
„The theory proposed by Sir Joseph Larmor (...) is examined and shown to be faulty″
Generation of toroidal from poloidal field by differential rotation („-effect″) But toroidal → poloidal ???
„ ... one does not expect an irregular cause to build up to give a regular effect.″
Eugene N. Parker (1955)
Coriolis force Robert B. Leighton (1964, 1969) Horace W. Babcock (1961) Sunspot group tilt Random walk
(1955)
Coriolis force
K.-H. Rädler The turbulent dynamo
models for the Sun, stars, planets, galaxies, accretion disks,...
1970s - the glorious decade:
Magnetic buoyancy (Parker, 1975): → Magnetic flux lost from the convection zone within months? First 3D-MHD simulations (Gilman & Miller, 1981; Gilman, 1983): → No solar-like cycles?
Contours of equal rotation period (Howe et al., 2005)
Helioseismology Prediction of mean-field dynamo models: ddr < 0 → refuted
(Gilman, 1993)
Tachocline
(Brown et al., 1989)
Convective overshoot layer stably stratified at the bottom of the convection zone (Galloway & Weiss, 1981)
Overshoot-layer dynamo Interface dynamo
(Parker, 1993) (Galloway & Weiss, 1983)
(Choudhuri & Gilman, 1987)
Buoyantly rising flux tubes
Buoyantly rising thin flux tubes…
B = 105 G B = 104 G
(Caligari et al., 1995) (Weber et al., 2011)
… in simulated 3D convection
Surface flux transport simulations
Wang, Nash & Sheeley (1989)
Polar field Axial dipole Surface field as f() Hathaway & Rightmire (2010)
Duvall (1979, Howard & LaBonte (1981), Andersen (1987) …
Poleward meridional surface flow
Robert B. Leighton Horace W. Babcock
Wang (2005)
1961 1964
Does the subsurface return flow lead to the equatorward propagation of the activity belts?
Hathaway & Rightmire (2010)
surface Br subsurface B
Time-latitude diagrams ApJ 383, 431 (1991)
(Karak et al., 2014) (Dikpati & Gilman, 2006)
„Dynamo wars”: advection-dominated vs. diffusion-dominated
„Conveyor belt”
(Jiang et al., 2007)
The current paradigm…
Lemerle et al. (2015, 2017) „2D 2D model”
2D SFT (, ) 2D FTD (r, ) surface boundary condition flux emergence, source term Model parameters fixed by observational constraints via a genetic algorithm.
Wright & Drake (ApJ, 2016)
tachocline rotation
(Ekin Emag for B ~ 105 G; Rempel, 2006)
(Spruit, 2010)
differential rotation from flux of the polar field sufficient to supply the emerged flux
(Cameron & S., 2015)
the same activity-rotation law
(Wright & Drake, 2016)
fully convective dwarfs ( M7)
(Route, 2016) partly convective fully convective Rotation rate Activity →
→ Review by Brun & Browning (Liv. Rev. Sol. Phys., 2017) Gilman (1983) Brun et al. (2004) Käpylä et al. (2012) Ghizaru et al. (2011) Brun et al. (2004)
Masada et al. (2013) Strugarek et al. (2018) Augustson et al. (2018) Warnecke (2018) Fan & Fang (2016)
Fang & Fan (2014) Nelson & Miesch (2014) Chen et al. (2017)
Hideyuki Hotta Hotta et al. (2015) Hotta (2018): Significant effect on convection, meridional flow, differential rotation…
What have we learnt so far (in my view…)?
(possible without a tachocline, overshoots layer,…)
Which are the limitations of currently feasible 3D MHD simulations?
(buoyancy of thin flux concentrations maintained?)
Strugarek et al. (2018)
FTD models require extensive parametrization and 3D MHD models probably run in the wrong physical regime → a fully realistic dynamo model is not available at the moment
and can be based to a large degree on observations. Unknown conditions are condensed in a few (3) parameters.
parameter studies can be carried out easily.
Step 1: Surface transport of the emerged magnetic flux contained in systematically tilted bipolar magnetic regions leads to the reversal and buildup of opposite-polarity polar dipole field
Wang (2005)
Already proposed in Babcock & Babcock (1955)…
Flux transport simulation Observation
Groundbreaking work by Y-M. Wang and N.R. Sheeley
Time-latitude diagrams of Br @ surface
tilted bipolar magnetic regions
by diff. rotation, convection, and meridional flow
by the amount of magnetic flux transported over the equator
Whitbread et al. (2017)
Step 2: The poloidal magnetic flux connected to the polar field is wound up by latitudinal differential rotation, generating the toroidal field whose subsequent emergence produces tilted bipolar magnetic regions (sunspot groups).
Babcock (1961)
The strength of a cycle is correlated with the amplitude of the polar fields at the end of the previous cycle.
Solar polar field during activity minimum (proxy) Strength of next cycle
Hathaway & Upton (2016)
But: Correlation does not imply causation… Polar field and „poloidal field of the dynamo” in principle could be different, but produced by the same (hidden) process.
Q: What is the relevant poloidal flux for the solar dynamo?
Hale’s polarity laws → large-scale toroidal field of fixed orientation in each hemisphere during a cycle. Need to consider the net toroidal flux in a hemisphere, determined from the azimuthally averaged induction equation
Cameron et al. (2018) B at solar surface
Determine toroidal flux in a hemisphere: integrate induction equation over a meridional surface and apply Stokes theorem
Meridional cut
Cameron & S. Science 347, 1333 (2015)
Consider Strongly dominated by polar fields... Only significant contribution: surface part
Q: What is the relevant poloidal flux for the solar dynamo? A: The magnetic flux connected to the polar field represents the dominating poloidal source of the net toroidal flux which emerges in the subsequent cycle. Any other poloidal field (hidden in the convection zone) leads to equal amounts of positive and negative toroidal flux and thus does not contribute to the net toroidal flux required by Hales polarity laws.
Horace W. Babcock
(1912-2003)
Robert B. Leighton
(1919-1997)
Update of the BL model taken account of the
Cameron & S. (2017, A&A)
Sunspot numbers during the holocene as inferred from cosmogenic isotopes (10Be, 14C)
Considerable cycle-to-cycle variability with
Years BP
➢ nonlinear effects? ➢ intermittency? ➢ stochastic fluctuations?
(Usoskin et al., 2016)
Howard (1991)
Histogram of sunspot group tilt angles
(Mt. Wilson, 1917 – 1985) Leader spots nearer to equator Follower spots nearer to equator
Substantial scatter of sunspot group tilt angles A single large bipolar region carries an amount of magnetic flux comparable to that contained in the polar field. The weakness of cycle 24 can be understood as the effect of a few active regions with „wrong” tilt
(Jiang et al., 2015)
October 2014 The spot that killed the dynamo….
Nagy et al. (2017)
Wright & Drake (2016)
Actually, the slowly rotating Sun appears to be near marginal cyclic dynamo excitation
(van Saders et al., 2016; Metcalfe et al., 2016 Olspert et al., 2018)
The Sun is not a particularly active star…
Rotation rate Activity →
Tobias et al. (1995)
Dynamo excitation →
Models for oscillatory dynamos typically exhibit a Hopf bifurcation at critical dynamo excitation: a fixed point becomes unstable and spawns a limit cycle (periodic solution)
Re(X) Im(X)
Normal form Amplitude Frequency Linear growth rate Linear frequency
All four parameters are constrained by observation:
Recovery from Maunder minimum: ~11-year cycles during Maunder minimum: = 2/(22 yrs) Mean sunspot number since 1700: 64 for sinusoidal cycles
Noise amplitude:
from polar field variability due to observed tilt angle scatter (→ consistent with variability of cycle maxima since 1700)
complex Wiener process with variance = 1 after 11 years
(random walk with uncorrelated Gaussian increments)
Performed Monte-Carlo simulations with Euler-Maruyama method Random forcing of the dynamo owing to scatter of tilt angles: stochastic differential equation Take Re(X) as a proxy for sunspot number (toroidal flux):
Howard (1991)
Histogram of sunspot group tilt angles
(Mt. Wilson, 1917 – 1985)
Empirical sunspot numbers
left: direct observations right: inferred from cosmogenic isotopes (10Be, 14C)
Noisy normal-form model
(one realization)
Usoskin et al. (2016)
(cosmogenic isotopes)
Normal-form model
(1000 realizations of 10,000 years each)
standard deviation
Exponential distributions are consistent with a Poisson process.
sunspot record
sunspot record cosmogenic isotopes
sunspot record cosmogenic isotopes
Observation
normal form (350 yrs) normal form (10,000 years)
NF: one realisation
sunspot record cosmogenic isotopes normal form
(10,000 realizations)
sunspot record cosmogenic isotopes Babcock-Leighton
dynamo
(120 realizations)
Sunspot record & cosmogenic isotopes Normal-form model (10,000 realizations)
Cameron & S. (2019) maximum median 3 level
Probability of at least one 3 peak in 216 resolved frequency bins Period [yrs]
3 peaks from realizations
Gleissberg & de Vries peaks from cosmogenic isotopes
and on the conditions in other stars…
→ back to the roots (BL or even simpler) lumps unknown properties into a few parameters … as well as … → up to the treetop (3D MHD) quantitative understanding of basic processes
→ limited scope for predictions
„Many suggestive models illuminate various aspects of the solar cycle; but details are frequently obscure and more comprehensive calculations have still to be completed.″
„The shifting nuances of observation have many times in the past sunk a substantial theoretical ship, and the most likely explanation of today may be found washed up on the beach tomorrow.″
Sun: → flux emergence in tilted bipolar magnetic regions is crucial, determines of the excitation of the dynamo; → the connection between the subsurface toroidal field and flux emergence seems to be highly complex and non-trivial. Other magnetically active stars: internal differential rotation, convective flows, meridional flows, tilt angles… → mostly unknown → estimates require quantitative theoretical understanding of the interaction
→ complexity!
Chen et al. (2017)
Gleissberg domain: 75 yr − 100 yr De-Vries domain: 180 yr − 230 yr
Sun Sun NNF NNF
Solar data Model „The ancient Sun” (eds. Pepin, Eddy & Merrill; 1980)
Barnes et al. (1980):
Model results covering 2000 years… The full code:
appropriately written in BASIC: Beginner’s All-purpose Symbolic Instruction Code Auto-regressive moving-average (ARMA) model (iterative map) → white noise filtered around 1/22 cyc/year with bandwith 0.002 cyc/year
Long-term evolution:
Barnes et al. (1980):
Model results covering 2000 years…
Auto-regressive moving-average (ARMA) model (iterative map) → white noise filtered around 1/22 cyc/year with bandwith 0.002 cyc/year
Long-term evolution:
Is there anything we could learn from such a ‘model’ ?
Does randomness cause the variability of the solar cycle?
Poloidal field generated by a near-surface Babcock-Leighton process
(Karak et al., 2014)
Poleward and downward transport of poloidal field by meridional circulation and/or turbulent diffusion and/or pumping Toroidal field mainly generated by radial differential rotation in the tachocline Toroidal field stored in a stable layer and transported equatorward by meridional circulation. Flux tubes destabilize and rise buoyantly, are affected by the Coriolis force, and emerge.
(Cameron & S., 2017a)
(Cameron et al., 2018)
(Cameron & S., 2017b)
Cameron et al. (2018)
→ 3 parameters, constrained by comparison with observation return flow speed: V0 2 … 3 m/s turbulent diffusivity: 0 30 … 80 km2/s source strength: 1 … 3 m/s
Q: What is the relevant poloidal flux for the solar dynamo? Hale’s polarity laws imply that bipolar magnetic regions result from a large-scale toroidal field of fixed orientation in each hemisphere during a cycle. Need to consider the net toroidal flux in a hemisphere, determined from the azimuthally averaged induction equation: B(r,): azimuthally averaged magnetic field, U(r,): azimuthally averaged velocity, u, b : fluctuations w.r.t. azimuthal averages,
: molecular diffusivity
Determine toroidal flux in the northern hemisphere by integrating
Rotation dominates: reduces to „turbulent” diffusivity, t
Meridional cut
Cameron & S. (2015)
Consider Part a: almost independent of r in the equatorial plane:
Meridional cut
Move in a frame rotating with → no contribution
Near-surface shear layer Tachocline
Cameron & S. (2015)
Move in a frame rotating with → no contribution Consider Part a: almost independent of r in the equatorial plane: Part b: below convection zone, B=0 → no contribution Part c: along the axis, B=U=0 → no contribution Part d: the surface part of the integration provides the only significant contribution
Meridional cut
Cameron & S. (2015)
Quantitative evaluation: use Kitt Peak synoptic magnetograms (1975-) and the observed surface differential rotation
The integrand is dominated by the contribution from the polar fields.
Cameron & S. (2015)
Time integration of
solid: modulus of the net toroidal flux dashed: total unsigned surface flux, (KPNO synoptic magnetograms)
red: northern hemisphere blue: southern hemisphere
Cameron & S. (2015)
An update of the model (Cameron & S., 2017, A&A) takes into account information not available to B&L: → differential rotation in the convection zone → near-surface shear layer → meridional flow → (turbulent) magnetic diffusivity affecting Btor → convective pumping → randomness in flux emergence Consider radially integrated toroidal flux and radial surface surface field parameter space significantly reduced to basically three parameters: → turbulent diffusivity → poloidal source strength → speed of meridional return flow
NSSL
NSSL
(activity) and polar fields : ~90 deg
quadrupole mode decaying → Constraints: return flow speed: V0 2 … 3 m/s turbulent diffusivity: 0 30 … 80 km2/s source strength: 1 … 3 m/s Parameter values strongly constrained by observation:
Contribution of bipolar magnetic regions with a flux of 61021 Mx to the axial dipole moment around solar minimum as a function of emergence latitude Jiang et al. (2014)
The dipole moment around solar minimum – and thus the strength of the next activity cycle – is most strongly affected by the relatively small number of near-equator bipolar magnetic regions.
Howard (1991)
Histogram of sunspot group tilt angles
(Mt. Wilson, 1917 – 1985) Leader spots nearer to equator Follower spots nearer to equator
Substantial scatter of sunspot group tilt angles
before 1960
1980s… Parker loop (1955), Babcock scenario (1961), Leighton model (1964/1969), Mean-field electrodynamics & „turbulent dynamos” (1960s onward) Surface flux transport simulations (Wang & Sheeley, …) Flux transport dynamo models, Babcock-Leighton revival 1990s…today
Spherical 3D MHD comprehensive simulations
The 1990s and beyond: new aspects
consistent combination of the generation of differential rotation („-effect″) and magnetic field (Kitchatinov, Rüdiger, et al.)
for helical/non-helical as well as turbulent/laminar flows
but still no solar-like large-scale fields
(compare with the success of realistic simulations of surface magneto-convection)
Why update an ancient model in the era of Flux Transport Dynamos & 3D simulations?
in the convection zone is unknown: FTD models require extensive (arbitrary) parametrization and 3D MHD models probably run in the wrong physical regime → a fully realistic dynamo model is not possible at the moment
and can be based as far as possible on observations. Unknown conditions are condensed in a few free parameters.
studies can be carried out easily.
[Cameron & S., 2017]
Update Leightons model taking into account:
Leightons model (1969):
serves as nonlinearity and source of poloidal field
NSSL: radial shear, radial magnetic field (through pumping) ~15 m/s poleward meridional flow @ surface poloidal field (turns over above tachocline) tilted bipolar magnetic regions: effective surface turbulent diffusivity @ surface (Br): 250 km2/s
strength of the Coriolis effect
turbulent diffusivity affecting b(,t)
radial shear below NSSL
effective merid. return flow affecting b(,t)
Test by comparison with 2D FTD models
(1919, ApJ) Northern hemisphere Southern hemisphere Equator Solar rotation
Consistent with the Coriolis effect on rising & expanding loops of magnetic flux
Solar rotation
Differential rotation Meridional return flow Turbulent diffusion
Meridional flow Turbulent diffusion Tilted bipolar magnetic regions
No artificial restriction
to low latitudes!
Parameters:
CZ = 80 km2/s = 1.4 m/s = 1.
V0 = 2.5 m/s Radial field Br(,t) @ surface Toroidal flux b(,t)
(Cameron & S., 2017, A&A)
= 1.4 m/s = 1.
Period Phase difference Growth rate dipole Growth rate quadrupole period between 21 and 23 years phase diff. between 80 and 100
maxima of flux emergence (activity) and polar fields should be ~90 deg
excited, quadrupole mode should be decaying → Constraints: return flow speed: V0 2 … 3 m/s effective diffusivity: 0 30 … 80 km2/s Coriolis effect: 1 … 3 m/s Requirements:
(Cameron & S., 2017, A&A)
period 21-23 yr phase diff. 80-100 growth rate >0 → Constraints: return flow speed: V0 2 … 3 m/s effective diffusivity: 0 30 … 80 km2/s Coriolis effect: 1 … 3 m/s long-term
➢ Polar fields reversed and built-up by surface transport of emerged flux
(flux transport models by Wang & Sheeley + many others)
➢ Strength of a cycle correlates with the amplitude of the polar fields in the preceding minimum
(precursor methods for cycle prediction)
➢ Only flux connected to the surface provides a source for net toroidal flux in a hemisphere. The winding up of the flux connected to the polar fields by (azimuthal) differential rotation generates sufficient toroidal field to cover the flux emerging in the subsequent cycle
(Cameron & S., 2015)
➢ BL models with source fluctuations reproduce long-term statistics of activity levels, including grand minima and maxima
(Cameron & S. 2017, 2019)
➢ The observed azimuthal surface field (a proxy for flux emergence) evolves in accordance with the updated BL model
(Cameron et al. 2018)
➢ The hemispheric asymmetry of solar activity can be quantitatively understood by a superposition of an excited dipole mode and a damped quadrupole mode of the BL dynamo
(S. & Cameron, 2018)
Helioseismology, surface observations, comprehensive simulations
„turbulent diffusion”, „turbulent/convective pumping”, … ?
in comparison to the large-scale Babcock-Leighton mechanism (active region tilt)? Comprehensive simulations, surface observations
Generally we have „Turbulent” diffusion (flux loss at the axis and random-walk transport over the equator) is crudely approximated by an exponential decay term:
1980 1990 2000 2010 Year 1 2 3 4 5 6 7 8 Flux [1023 Mx]
A
1980 1990 2000 2010 Year 1 2 3 4 5 6 7 8 Flux [1023 Mx]
B
1980 1990 2000 2010 Year 1 2 3 4 5 6 7 8 Flux [1023 Mx]
C
1980 1990 2000 2010 Year 1 2 3 4 5 6 7 8 Flux [1023 Mx]
D
Schou et al. (1998)
The contribution to tor by radial diff. rotation is a few %
Near-surface shear layer Tachocline
Near-surface shear layer (NSSL) Tachocline
Part a: Assume 51022 Mx poloidal flux threading the NSSL a d Part d: Assume 51022 Mx poloidal flux through 30 deg polar cap
… were rather successful in reproducing the observed (or reconstructed) evolution of polar fields in cycles 15-22, but…
signed quantity unsigned quantity
Hale & Nicholson (1925)
Hale & Nicholson (1925)
An analoguous expression is valid for the southern hemisphere. Result: the amount of net toroidal flux is determined by the surface distribution of emerged magnetic flux and the latitudinal differential rotation.
Comparison between SFT and 2D flux transport dynamo (Cameron et al., 2012) → radial pumping required! Cameron et al. (2018) B at solar surface… …resulting from flux emergence Results:
Jiang et al. (2015)
Kitt Peak synoptic magnetogram for CR 1772 (February 1986)
Cameron et al. (2012)
Single bipolar regions emerging near or across the equator can have a significant impact on the built-up of the polar flux.
Barnes et al. (1980):
Model results covering 2000 years…
Auto-regressive moving-average (ARMA) model (iterative map) → white noise filtered around 1/22 cyc/year with bandwith 0.002 cyc/year
Long-term evolution:
Is there anything we could learn from such a ‘model’ ?
Perhaps yes: Randomness could be important for the variability of the solar cycle
Birch et al. (2016): rise speed of flux loops consistent with convective velocities down to 20 Mm depth Fang & Fan (2014) Nelson & Miesch (2014) Chen et al. (2017)
Wright & Drake (ApJ, 2016)
tachocline rotation
(Ekin Emag for B ~ 105 G; Rempel, 2006)
(Spruit, 2010)
rotation from flux of the polar field is sufficient to supply the emerged flux
(Cameron & S., 2015)
convection zone and emergence of loops are exhibited by 3D MHD simulations
(e.g., Nelson & Miesch, 2014; Fan & Fang, 2014)
fully convective dwarfs ( M7)
(Route, 2016)
activity-rotation law
(Wright & Drake, 2016)
partly convective fully convective Rotation rate Activity →
within the convection zone (without tachocline, overshoot layer, etc.)
may form within the convection zone
against magnetic stresses (Rempel, 2006; Spruit, 2010)?
& subadiabatic ‘storage region’ (e.g. Hotta, 2017)?
(Karak et al., 2014)
have a reliable 3D-MHD simulation
wait until then?
in the meantime through observations, theory & simple models?