
SLIDE 1
The Politics of Transforming Education in Ecuador 2006-2017
Ben Ross Schneider, Pablo Cevallos Estarellas, and Barbara Bruns
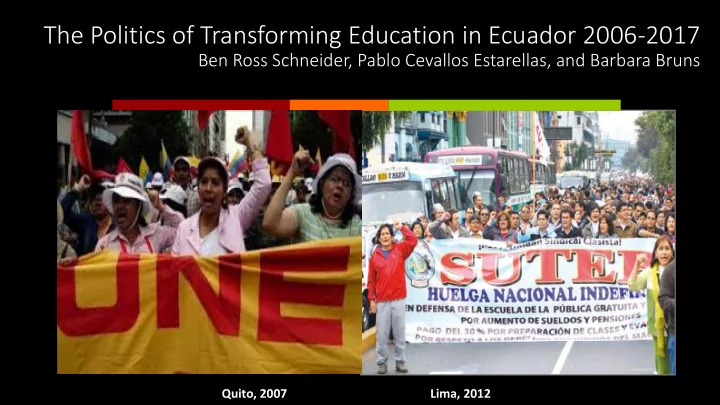
Quito, 2007 Lima, 2012
The Politics of Transforming Education in Ecuador 2006-2017 Ben Ross - - PowerPoint PPT Presentation
The Politics of Transforming Education in Ecuador 2006-2017 Ben Ross Schneider, Pablo Cevallos Estarellas, and Barbara Bruns Quito, 2007 Lima, 2012 1. Ecuadors education transformation in an Andean context 2. What drives learning
Quito, 2007 Lima, 2012
492 511 400 420 440 460 480 500 520
2006 2013
e
LA average* Math Scores on Second (SERCE) and Third Regional Test (TERCE)
517 581 492 511 400 420 440 460 480 500 520 540 560 580 600
2006 2013
e
Chile LA average* Math Scores on Second (SERCE) and Third Regional Test (TERCE)
517 581 490 527 492 511 400 420 440 460 480 500 520 540 560 580 600
2006 2013
e
Chile Peru LA average* Math Scores on Second (SERCE) and Third Regional Test (TERCE)
517 581 460 513 490 527 492 511 400 420 440 460 480 500 520 540 560 580 600
2006 2013
e
Chile Ecuador Peru LA average* Math Scores on Second (SERCE) and Third Regional Test (TERCE)
250 300 350 400 450 500 550 2000 2003 2006 2009 2012 2015
Chile Peru OECD Average Math scores on PISA
Note: Values for Peru interpolated from 2000-2009
Source: Evans and Popova, What Really Works to Improve Learning in Developing Countries, 2015
Source: Glewwe and Muralidharan, 2015
Effective professional development Secondary school Teacher education Teaching in a school Screening point 1: Selectivity of entry into teacher ecucation Screening point 2: Standards for teacher hiring Periodic Teacher performance evaluation – retain high quality, remove low quality High quality preparation for teaching Good school leaders How it works in Finland, Singapore, Canada, Japan, Korea, Shanghai
Financial (salaries, benefits, trajectory) and professional incentives (quality of peers, working conditions) attract talented people
Little or no effective professional development Academically weak students – bottom half of high school grads Academically weak preparation No emphasis on practice/Delinked from schools Teaching in a school No selectivity No selectivity Automatic promotion Job stability No performance evaluation Large number of low quality institutions
Financial (salaries, benefits, trajectory) and professional incentives (quality of peers, working conditions) not competitive with other sectors
Non- merit school leaders How it works in low-performing countries…
Policy goals and instruments
Ecuador 2007-15 Chile 2004-16 Peru 2009-14 Wash DC 2010
More selective and higher quality pre-service education (selection pt. 1) ü ü ü
ü ü ü
ü ü ü
ü
ü Higher standards for new teachers (selection point 2) ü ü ü ü
ü ü ü ü
ü ü ü ü Individual teacher performance evaluation ü ü ü ü
ü ü ü ü
ü ü ü ü Promotion based on skills and performance ü ü ü ü
ü ü ü ü Higher quality professional development ü ü ü ü
more in-service training, higher quality training) ü ü ü ü
What worked?
What looks problematic?
support and cultivate teacher buy-in.
requisites and retribution.
education system other than teachers – e.g., school leaders and supervisors.
they do not address the flaws they were meant to solve.