
SLIDE 1
¡ 1 ¡
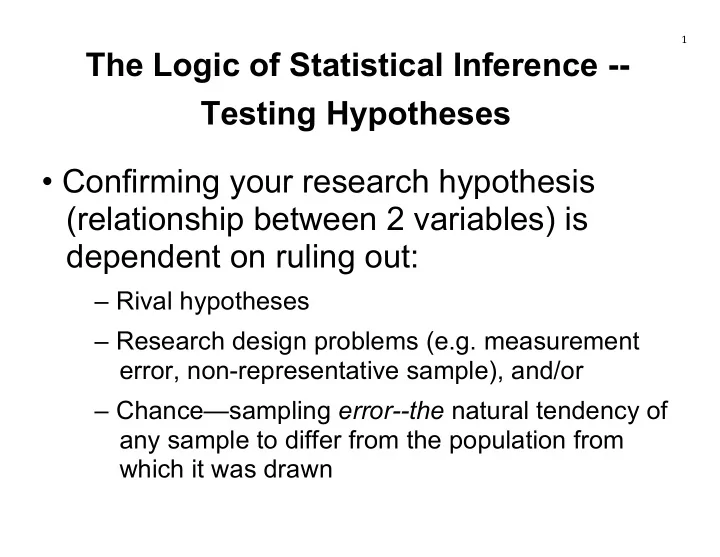
The Logic of Statistical Inference -- Testing Hypotheses
- Confirming your research hypothesis
The Logic of Statistical Inference -- Testing Hypotheses - - PowerPoint PPT Presentation
1 The Logic of Statistical Inference -- Testing Hypotheses Confirming your research hypothesis (relationship between 2 variables) is dependent on ruling out: Rival hypotheses Research design problems (e.g. measurement error,
¡ 1 ¡
¡ 2 ¡
¡ 3 ¡
¡ 4 ¡
¡ ¡
¡ 5 ¡
¡ 6 ¡
¡
¡ 7 ¡
¡ 8 ¡
¡
¡ 9 ¡
¡ 10 ¡
¡ ¡
¡ 11 ¡
¡
¡ 12 ¡
¡ 13 ¡
¡ 14 ¡
¡ 15 ¡
¡ ¡